Factor and Sector Behavior Across Macro Regimes
Key findings
- Navigating uncertainty about the path of interest rates and growth could be eased through a better understanding of how factor and sector indexes have performed across various interest-rate and economic-growth regimes.
- Looking back nearly 50 years, we found that a change in rates impacted factor and sector index performance more than the rate level itself.
- The returns of defensive sectors and certain factor indexes (e.g., low volatility and quality) have shown marked inverse correlations to interest-rate changes, after accounting for market movements and economic growth.
Although central banks in the U.S. and Europe are still indicating a willingness to consider rate cuts in 2024, uncertainty about the timing and size of cuts remains.[1] Complicating matters, economic growth has picked up across much of the developed world, which could encourage an unusual regime of rate cuts amid strong growth.
In this blog post, we study the historical relationships between interest rates and economic growth and the performance of style factors and Global Industry Classification Standard (GICS®)[2] sectors from November 1975 through December 2023. Our analysis was motivated from the belief that better insight into the past could shed light on how rate changes and the economic cycle could influence the performance of a portfolio's factor and sector allocations.
Rate changes had a larger performance impact than rate levels
We examined the active performance of factors and sectors, using the factor and sector indexes of the MSCI World Index as proxies, compared to the performance of the MSCI World Index in both high and low interest-rate regimes and over periods of rising and falling interest rates; our analysis uses the U.S. Treasury 10-year bond yield as an interest-rate proxy. We divided the historical factor and sector indexes' performance into quintiles to represent regimes from low (1) to high (5) yield level and from falling (1) to rising (5) one-month yield changes.
While, overall, we found a change in rate impacted their performance more than the rate level itself, there was variation.[3] High-yield and value factor indexes have performed well in the current rate regime, consistent with a 4.62% 10-year yield, as of April 19, 2024. This regime is similar to the median-yield (3) quintile.
Average monthly returns of factor indexes versus the MSCI World Index
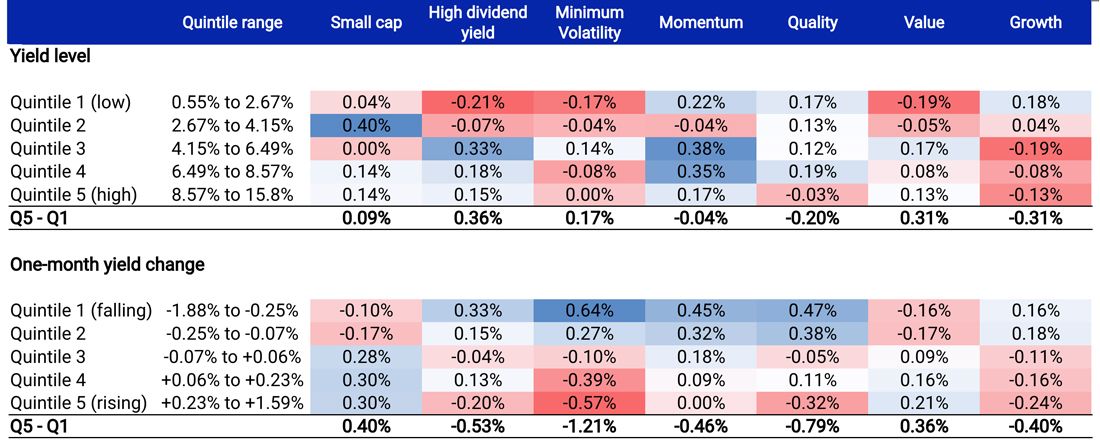
Data is from November 1975 through December 2023. Index returns are gross in USD. The factor indexes are those of the MSCI World Index and are benchmarked against that Index. The simulated history of the MSCI World Small Cap Index prior to December 1998 was proxied by the MSCI World Equal Weighted Index. Source: Federal Reserve of St. Louis Economic Data (FRED)
As expected, the high-yield factor performed well in a falling rate environment as the yield offered by dividend-paying stocks became more attractive compared to the yield on fixed-income securities. Lower rates also increase the present value of future dividends, which potentially drives up the prices of dividend-paying stocks. Defensive, or low-beta, factors such as low volatility and quality also performed well as rates fell. Value and low-size factors performed well when yields were moderate or rising.
Average monthly returns of sector indexes versus the MSCI World Index
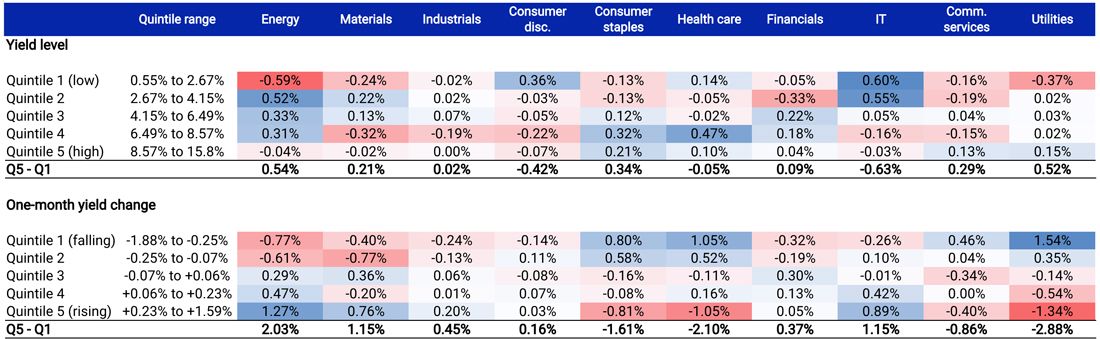
Data is from November 1975 through December 2023. Index returns are gross in USD. The sector indexes are those of the MSCI World Index and are benchmarked against that Index. The simulated history of the MSCI World Small Cap Index prior to December 1998 was proxied by the MSCI World Equal Weighted Index. Source: Federal Reserve of St. Louis Economic Data (FRED)
The low-beta sectors, such as consumer staples and health care, exhibited the same, but stronger, relationship with rates as the defensive factors. For example, utilities was the most rate-sensitive sector and benefited the most from falling rates. Financials outperformed when yields were moderate to high and stable.
Relationships remained strong after controlling for market movements and economic growth
Although rate changes tend to impact economic growth, proxied by the Organization for Economic Cooperation and Development's (OECD) composite leading indicator (CLI), the effect could be lagged, and we did not find a strong overlap between the two. To examine how factor and sector performance reacted to shifts in interest rates and economic growth over the study period, we conducted a multi-factor regression analysis.[4]
The performance of defensive factor indexes, such as low volatility and quality, showed a strong and significant negative relationship to changes in rates (rising rates, poorer performance, and vice versa), even after considering the effects of market movements and economic growth. Value displayed a notably positive correlation with rate changes (rising rates, stronger performance, and vice versa), whereas the opposite was true for growth. The low-size index performed strongly, not only during rising rates, but also as economic growth improved.
Rate and economic-growth sensitivities of MSCI factor and sector indexes
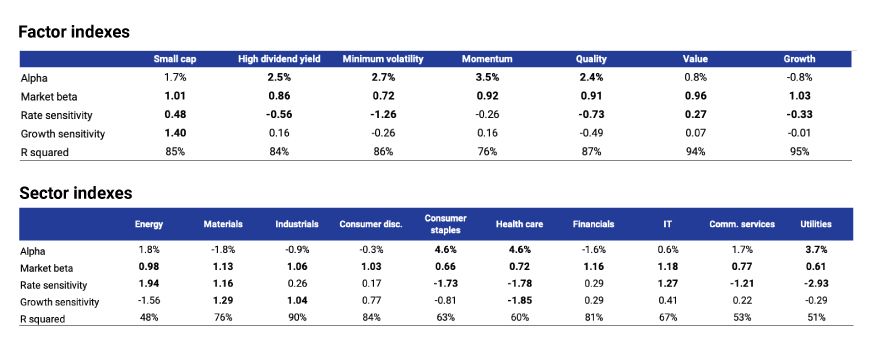
Data is from November 1975 through December 2023. Index returns are gross in USD. The factor and sector indexes are those of the MSCI World Index. The simulated history of the MSCI World Small Cap Index prior to December 1998 was proxied by the MSCI World Equal Weighted Index. Coefficients corresponding to t-stats significant above the 95% confidence level are highlighted in bold. Source: FRED, OECD
In general, sector indexes demonstrated a stronger relationship than factor indexes to changes in both rates and economic growth. Low-beta sectors, such as health care and consumer staples, displayed pronounced negative sensitivities to both macro variables (better performance in periods of slower growth and falling rates, and vice versa), while materials, energy and information technology exhibited a notably positive sensitivity (strong performance) to rising rates. Materials, along with industrials, also performed well during periods of improving economic growth, even after accounting for changes in rates.
Learning from past relationships
Over the last nearly 50 years, interest rates and economic-growth cycles have been associated with strongly different performance of factor and sector indexes. Rate changes had a more pronounced impact on performance than rate level. Awareness of these historical relationships may offer insights to investors considering portfolio reallocations in response to a shifting macro view.
The author would like to thank Rahul Suresh Kumar for his contributions to this blog post.

Subscribe todayto have insights delivered to your inbox.
1 The Bank of Japan, the one major exception in the developed world, increased its short-term policy rate from -0.1% to between 0% and 0.1% in March 2024.2 GICS is the global industry classification standard jointly developed by MSCI and S&P Global Market Intelligence.3 The yield-level quintiles tend to reflect the high interest rates in the earlier years of the analysis period. Investors anticipating sustained lower interest rates, compared to earlier peaks, may wish to focus on outcomes related to the lower quintiles or conduct the analysis over a shorter time frame.4 The regression analysis allows us to understand the impact of the two macro variables (growth and rates) on factor and sector index performance and to control for the impact of market movements. The regressions also helped us to quantify the sensitivity of performance to each macro variable as well as measure the statistical significance of the sensitivities (t-stats): 𝑅𝑖𝑛𝑑𝑒𝑥=𝛼 + 𝛽𝑚𝑎𝑟𝑘𝑒𝑡.𝑅𝑚𝑎𝑟𝑘𝑒𝑡 + 𝛽𝑟𝑎𝑡𝑒𝑠.𝛥10−𝑦 𝑦𝑖𝑒𝑙𝑑 + 𝛽𝑒𝑐𝑜 𝑔𝑟𝑜𝑤𝑡ℎ .𝛥𝐶𝐿𝐼. The change in the CLI (𝛥𝐶𝐿𝐼) factor is divided by 100 to be on the same scale as the other two regression factors — market return and change in yield (𝛥𝑦𝑖𝑒𝑙𝑑).
The content of this page is for informational purposes only and is intended for institutional professionals with the analytical resources and tools necessary to interpret any performance information. Nothing herein is intended to recommend any product, tool or service. For all references to laws, rules or regulations, please note that the information is provided “as is” and does not constitute legal advice or any binding interpretation. Any approach to comply with regulatory or policy initiatives should be discussed with your own legal counsel and/or the relevant competent authority, as needed.