Have corporate green bonds offered lower yields?
Blog post
March 10, 2020
- Definitions of green bonds can vary widely. Using a standard set of criteria can help investors study how green bonds' yield characteristics compare with those of non-green bonds.
- In general, corporate green bonds tended to offer yields 0 to 2 basis points lower than comparable non-green corporate bonds, during our study period.
- Green bonds from corporate issuers with higher environmental scores tended to more reliably offer lower yields than comparable non-green bonds.
Green bonds' rapid growth
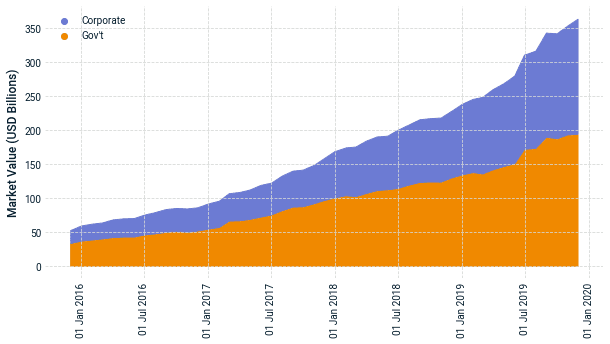
Source: Bloomberg Barclays MSCI Global Green Bond Index, MSCI.
Examining green bonds' lower yields
We looked at the spread of conventional bonds' yields over green bonds' yields — the green-bond yield difference. The exhibit below shows the median green-bond yield difference of corporate issuers. Although there was a lot of variation, there appears to have been a slight (0-2 basis points) difference in aggregate.6 As the underlying credit risk is the same for green bonds as non-green bonds, higher demand for green bonds likely drove their yields lower.7
Green-bond yield difference of corporate issuers
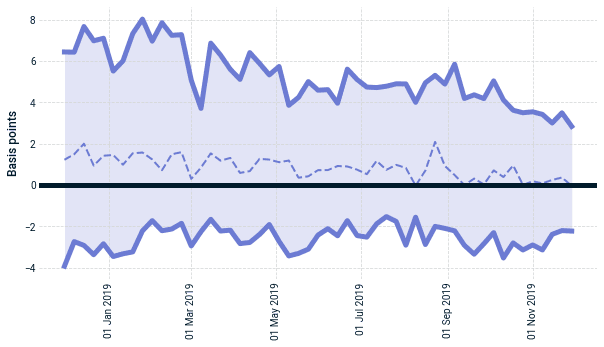
Source: MSCI RiskMetrics® RiskManager® calculations with MSCI issuer curves. Figure shows median (dotted thin line) with Q1-Q3 band (solid thick lines).
The ESG view
Does the issuer's ESG score matter? The relationship between the greenness of a green bond and the issuer's environmental score is complex: The greenness of a bond reflects the environmental quality of the specific project funded by the green bond, while the issuer's environmental score measures the issuer's long-term resilience in the context of environmental risks. At the same time, it is not unusual for investors to screen issuers using ESG criteria,8 which may tilt demand toward issuers with high ESG metrics.
The exhibit below compares the green-bond yield difference across issuers with high environmental scores and those with low scores. Note that the dispersion is much tighter, and the yield difference is more consistently positive for high-scoring issuers. Here, only bonds of high-scoring issuers appear to demonstrate any consistent green-bond yield difference, while those of low-scoring issuers did not seem to benefit as much.
Green-bond yield difference was related to issuer's environmental score
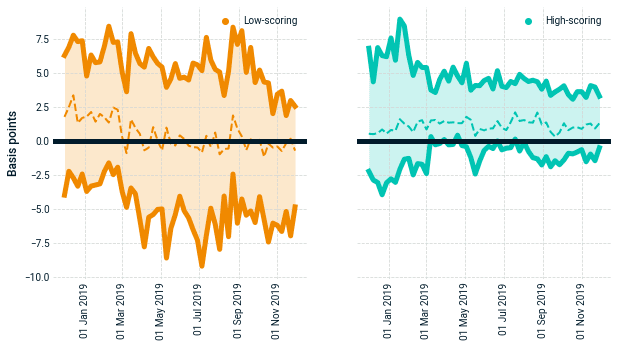
Figure shows median (colored, dotted thin line) with Q1-Q3 band (colored, solid thick lines) for each group. High- and low-scoring groups are bonds of issuers with environmental scores above or below the median, respectively. Source: MSCI RiskMetrics® RiskManager®.
The market for green bonds is expected to continue to evolve, as evidenced by interest from new players such as central banks.9 Emergent investment themes may call for new analytical tools. Our analysis uses consistent criteria for evaluating green bonds, and we highlight nontraditional views of the market such as the ESG perspective.
Further Reading

Subscribe todayto have insights delivered to your inbox.
1“10 Years of Green Bonds: Creating the Blueprint for sustainability Across Capital Markets.” World Bank, March 18, 2019.2As of Dec. 31, 2019, the components of the Bloomberg Barclays MSCI Green Bond Index accounted for approximately USD 372 billion in market value.3Doran, M. and Tanner, J. “Critical challenges facing the green bond market.” , Sept. 23, 2019.4Pronina, L. and Freke, T. “As Green Bonds Boom, So Do ‘Greenwashing’ Worries.” Bloomberg, Oct. 14, 2019.5We focused on a set of 75 unsubordinated bonds from corporate issuers with MSCI issuer curves, tracked over an analysis period of 53 weeks.6The magnitude and sign of the yield difference are consistent with some previous findings. See: Zerbib, O.D. 2019. “The effect of pro-environmental preferences on bond prices: Evidence from green bonds.”.7“Investors may pay ‘greenium’ as green bond demand outstrips supply.” S&P Global Market Intelligence, March 28, 2018.8Bowman, L. “ESG: green bonds have a chicken and egg problem.” , June 19, 2019.9“BIS launches green bond fund for central banks.” Bank for International Settlements, Sept. 26, 2019.
The content of this page is for informational purposes only and is intended for institutional professionals with the analytical resources and tools necessary to interpret any performance information. Nothing herein is intended to recommend any product, tool or service. For all references to laws, rules or regulations, please note that the information is provided “as is” and does not constitute legal advice or any binding interpretation. Any approach to comply with regulatory or policy initiatives should be discussed with your own legal counsel and/or the relevant competent authority, as needed.