Macro Scenarios in Focus: Structurally Higher Inflation and Rates
Key findings
- Several secular trends may keep inflation and rates elevated, dragging down growth and portfolio returns.
- Multi-asset-class investors may face reduced diversification benefits as elevated inflation and constrained central-bank policies may drive simultaneous sell-offs in bonds and equities.
- Under our scenario, yield-bearing assets may recover against baseline expected real returns through higher income, while equities may face underperformance and weaker growth.
Inflation has eased recently, but secular trends like surging debt levels, deglobalization, aging populations and supply-chain disruptions could keep it elevated in the longer run, along with rates.[1] This poses challenges for multi-asset-class investors, as bonds may offer less diversification than in a lower-inflation regime. In this edition of Macro Scenarios in Focus, we assess how elevated rates and inflation's drag on long-term growth could be a headwind for growth assets. Under our scenario, the value of a diversified portfolio of global equities and U.S. bonds could lose 11%, as both sell off simultaneously. In the longer run, however, yield-bearing assets recover their shortfall against the baseline expected real return, as higher income offsets the negative price return.
Secular trends may keep inflation and rates high
Demographic shifts toward aging populations and restrictions on immigration will tighten labor markets, pushing up wages and health-care costs. Deglobalization, potential trade wars and reshoring could raise production expenses, while climate and geopolitical disruptions threaten the stability of supply chains, adding further inflationary pressures. Expansive fiscal spending, a theme we explored previously, may fuel debt levels and put upward pressure on long-term rates.[2] Under all these dynamics, interest rates may not return to pre-pandemic levels and could pose a headwind to economic growth.
Historical data suggests that in periods of elevated inflation and weak growth, the correlation between Treasury yields and equities tends to be negative, as the Federal Reserve must weigh the growth-stimulating benefits of rate cuts against the risk of exacerbating inflation (see exhibit below).[3] Furthermore, as discussed in our paper on the MSCI Macro-Finance Model, persistent inflation could de-anchor inflation expectations and — combined with potential diminished Fed independence — erode central-bank credibility, further driving the rate-equity correlation into negative territory.
Bond-equity correlation has depended on the inflation regime

Exponentially weighted moving-average estimate of the correlation between U.S. equities and the 10-year Treasury yield, using a two-year half-life and a daily return horizon.
The co-movement between bond and equity prices is particularly relevant during equity sell-offs. The exhibit below shows that sell-off behavior aligns with the observed correlation regimes. For example, during the COVID-19 sell-off (U.S. equities -34%), a 60/40 equity/bond portfolio fared better (-18%), as bonds gained 5%. In contrast, during the 2022 high-inflation sell-off (U.S. equities -26%), the same 60/40 portfolio fell by 21% as bonds dropped 14%.
When inflation is a pressing concern, the Fed tends to hold off on cutting rates, even during periods of economic stress. In the 2000s, as inflation fears eased, the Fed showed greater flexibility, lowering rates to support the economy and bolster the stock market during downturns. Today, with inflation back in the spotlight, we're seeing a return to the pre-2000 approach, where maintaining price stability takes precedence over short-term economic relief.
Bonds did not cushion equity losses in high-inflation regimes

We identified major U.S. equity drawdowns and registered how the 10-year Treasury yield moved during these sell-offs. Dots are labeled with the start date of the equity sell-off. Data between 1966 and 2024. Source: Federal Reserve Bank of St. Louis, Fama-French Data Library, MSCI
A scenario for elevated inflation and rates
We model a macroeconomic scenario, capturing upward pressure on the 10-year Treasury yield of +200 basis points (bps) and 10-year average inflation (+100 bps), and a drag on 10-year average growth (-80 bps). The shift in macroeconomic expectations leads to an instantaneous repricing, outlined in the table below.[4]
What we assume in our scenario
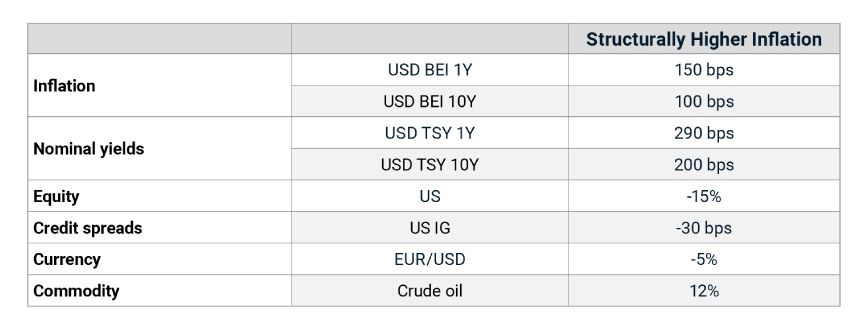
Assumptions about risk-factor shocks are informed by the MSCI Macro-Finance Analyzer. Breakeven inflation (BEI) is measured in basis points (bps). A negative shock for EUR/USD implies a strengthening U.S. dollar relative to the euro.
Implications for financial portfolios
To evaluate the impact of this scenario on multi-asset-class portfolios, we used MSCI's predictive stress-testing framework and applied it to a hypothetical global diversified portfolio consisting of global equities and U.S. bonds and real estate.[5] Under the scenario, the portfolio's value dropped 11%, as both bonds and equities traded down simultaneously — in contrast to the 2000-2022 period, when equity declines were often accompanied by falling rates, reflecting a different market regime.[6] Even inflation-linked securities like TIPS are not immune to losses, as sharp central-bank rate hikes to combat inflation drive higher real yields, eroding their prices. The exhibit below provides more detailed results.
'No place to hide' under this scenario
Loading chart...
Please wait.
Portfolio impact of the scenario based on market data as of Jan. 3, 2025. The above stress-test results capture the effect of instantaneous repricing of the assets. Source: S&P Global Market Intelligence, MSCI.
Under our scenario, bonds sell off initially as rates rise but eventually recover (partly) over the long term compared to the baseline expected real return due to higher income generation. Equities struggle to recover in real terms, however, as weaker growth hurts fundamentals over the long run.
Over long term, fixed-income assets benefit from higher income, equities suffer from growth drag

Cumulative impact on real profit and loss relative to the baseline scenario. For instance, a -20% cumulative real P&L after 10 years indicates that U.S. equity underperformed the baseline expected return by 20% in real terms.
Structurally higher rates may challenge traditional portfolio strategies
This blog post examined the impact of structurally higher inflation and interest rates on portfolios. In our stress-test scenario, a diversified portfolio fell by 11%, as bonds and equities sold off simultaneously. While bonds may recover through higher income over time, equities could face prolonged challenges from weaker growth, highlighting the potential to revisit portfolio strategies for a high-inflation regime — a dynamic that marks a significant shift after decades of relatively low inflation and subdued monetary-policy challenges.
The authors thank Will Baker for his contributions to this blog post.


Subscribe todayto have insights delivered to your inbox.
1 “World Economic Outlook (October 2024): Policy Pivot, Rising Threats,” International Monetary Fund, Oct. 9, 2024.2 In a previous blog post, we examined two downside scenarios related to rising sovereign-debt levels.3 Historical episodes can also offer valuable context: The 1970s, for instance, marked the era of the “Great Inflation,” with inflation peaking at 13.3% in 1979 and the decade's 10-year average surging to 6.8%, up from 2.3% in the 1960s. This inflationary spiral, driven by oil shocks, loose monetary policy, fiscal imbalances and ineffective wage-price controls, created the challenging backdrop of stagflation.4 The scenario was modeled using the MSCI Macro-Finance Model. MSCI's baseline and stressed scenario can be accessed in the MSCI Macro-Finance Analyzer. This is not a forecast, but a hypothetical narrative of how the macroeconomic scenario could affect multi-asset-class portfolios instantaneously.5 Treasury inflation-protected securities (TIPS) are represented by the iBoxx TIPS Inflation-Linked Index provided by S&P Dow Jones Indices. U.S. Treasurys, equities and corporate bonds are represented by MSCI indexes. Private equity is represented by model portfolios. U.S. real estate is represented by the MSCI/PREA U.S. AFOE Quarterly Property Fund Index. The composite portfolio is 50% global equities (35% public and 15% private), 10% U.S. Treasurys, 10% TIPS, 10% U.S. investment-grade bonds, 10% U.S. high-yield bonds and 10% U.S. real estate. The results are generated by using model correlations to propagate shocks to the portfolios, using MSCI's BarraOne®. MSCI clients can access the correlated BarraOne stress test here. A RiskMetrics® RiskManager® stress test can be downloaded from the MSCI Macro-Finance Analyzer (via the links above, by clicking the “Download” button).6 As an example, during the dot-com bubble (Sept. 4, 2000, to April 4, 2001), the U.S. equity market fell 28%, while one-year U.S. Treasury rates dropped by 230 basis points (bps) and 10-year U.S. Treasury rates declined by 60 bps. Similarly, during the global financial crisis (Oct. 9, 2007, to March 10, 2008), the U.S. equity market fell 19%, with one-year Treasury rates dropping 280 bps and 10-year rates falling 100 bps.
The content of this page is for informational purposes only and is intended for institutional professionals with the analytical resources and tools necessary to interpret any performance information. Nothing herein is intended to recommend any product, tool or service. For all references to laws, rules or regulations, please note that the information is provided “as is” and does not constitute legal advice or any binding interpretation. Any approach to comply with regulatory or policy initiatives should be discussed with your own legal counsel and/or the relevant competent authority, as needed.