Markets in Focus: Half-Time – Keeping it Real and Defensive
- Global equities were down 20% in the first half of 2022 – the worst six-month start to a year since 1975. For the second quarter of 2022, the MSCI Enhanced Value and High Dividend Yield Indexes delivered positive active returns across regional markets.
- To navigate an environment characterized by high volatility, rising rates, rising inflation and quantitative tightening, indexes linked to real assets, defensive sectors and factors might be constructive.
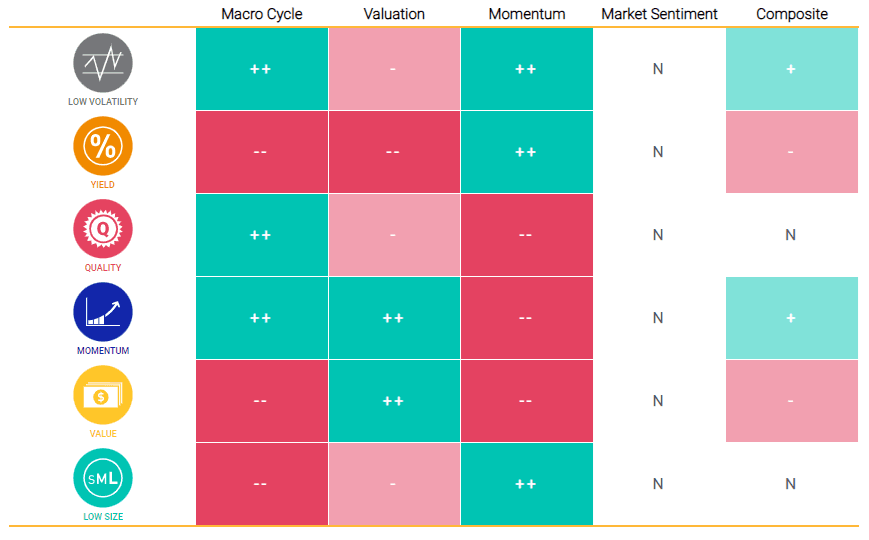
- MSCI's Adaptive Multi-Factor Allocation Model points to an overweight in low volatility and momentum as of June 30, 2022.


None | High Volatility (Oct. 2000 - March 2003) | Higher Rates (May 2004 - July 2007) | Quantitative Tightening (Oct. 2017 - March 2019) | Higher Inflation/Rates/Vol (Nov. 2021 - June 2022)* | Valuations (Fwd P/E) Current 20-yr Median |
Valuations (Fwd P/E) | Valuations (Fwd P/E) | None | None | None | None |
Current | 20-yr Median | None | None | None | None |
World | -18.5% | 16.3% | 5.0% | -16.9% | 14.5 14.9 |
14.5 | 14.9 | None | None | None | None |
None | Anualized Active Returns | Anualized Active Returns | Anualized Active Returns | Anualized Active Returns | Anualized Active Returns |
Real Assets | None | None | None | None | None |
World Agriculture & Food Chain | 15.1% | 0.0% | -0.1% | 20.7% | 14.8 17.6 |
14.8 | 17.6 | None | None | None | None |
World Commodity Producers | 11.5% | 18.2% | -1.3% | 37.2% | 6.9 12.6 |
6.9 | 12.6 | None | None | None | None |
World Infrastructure | -4.6% | 5.3% | -0.4% | 20.5% | 14.9 15.2 |
14.9 | 15.2 | None | None | None | None |
World Real Estate | 9.7% | 11.3% | 4.7% | 3.9% | 24.3 23.0 |
24.3 | 23.0 | None | None | None | None |
ACWI IMI Timber Select Capped | 15.0% | -9.4% | -10.3% | 6.5% | 10.0 14.7 |
10.0 | 14.7 | None | None | None | None |
Factors | None | None | None | None | None |
World Minimum Volatility (USD) | 7.2% | -1.7% | 3.8% | 9.9% | 17.1 16.5 |
17.1 | 16.5 | None | None | None | None |
World Enhanced Value | 6.9% | 12.3% | -6.0% | 10% | 7.9 10.8 |
7.9 | 10.8 | None | None | None | None |
World High Dividend Yield | 7.8% | 4.4% | -0.4% | 15.9% | 12.1 12.8 |
12.1 | 12.8 | None | None | None | None |
World Quality | 2.4% | -3.8% | 5.1% | -4.0% | 17.1 16.5 |
17.1 | 16.5 | None | None | None | None |
Sectors | None | None | None | None | None |
World Defensive Sectors | 3.8% | 0.2% | 1.5% | 18.6% | 14.3 15.7 |
14.3 | 15.7 | None | None | None | None |
Valuations (Fwd P/E) | Valuations (Fwd P/E) |
Current | 20-yr Median |
14.5 | 14.9 |
14.8 | 17.6 |
6.9 | 12.6 |
14.9 | 15.2 |
24.3 | 23.0 |
10.0 | 14.7 |
17.1 | 16.5 |
7.9 | 10.8 |
12.1 | 12.8 |
17.1 | 16.5 |
14.3 | 15.7 |
- Macro Cycle: Overweighted quality, low volatility and momentum with signals from the Chicago Fed National Activity Index, Federal Reserve Bank of Philadelphia's ADS Index and PMI all pointing to a slowdown.
- Valuation: Overweighted value and momentum based on the valuation gap compared to an equal-weighted factor mix in the context of nearly 30 years of a factor's history.
- Momentum: Selected low size, yield and low volatility based on relative performance over the last three months.
- Market Sentiment: Showed an overall neutral allocation to all factors due to selection of opposite set of factors from the indicators - an upward-sloping (normal) VIX term structure and widened credit spreads.


Subscribe todayto have insights delivered to your inbox.
The content of this page is for informational purposes only and is intended for institutional professionals with the analytical resources and tools necessary to interpret any performance information. Nothing herein is intended to recommend any product, tool or service. For all references to laws, rules or regulations, please note that the information is provided “as is” and does not constitute legal advice or any binding interpretation. Any approach to comply with regulatory or policy initiatives should be discussed with your own legal counsel and/or the relevant competent authority, as needed.