Stress testing US-China trade wars

Blog post
October 22, 2019
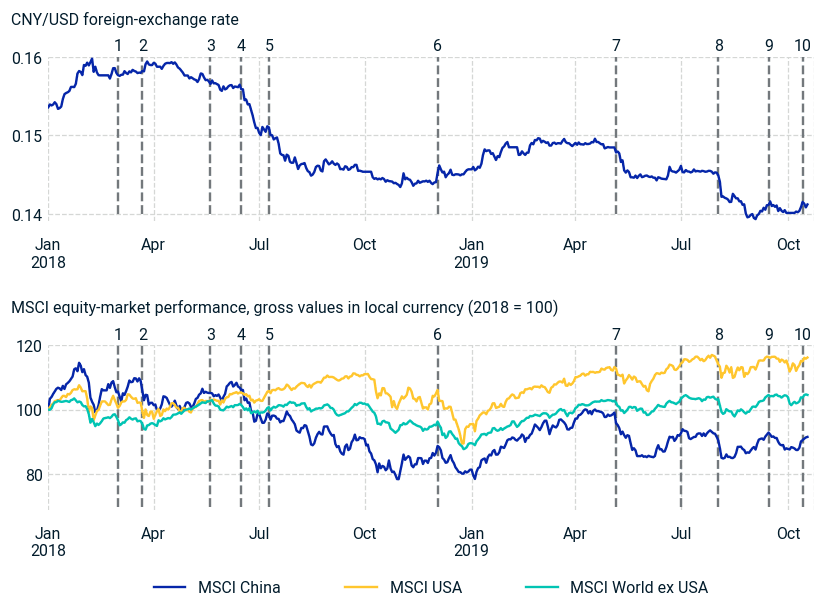
  • Considering recent developments in the U.S.-China trade talks, we proposed three stress-test scenarios to assess how this evolving story could impact financial markets.
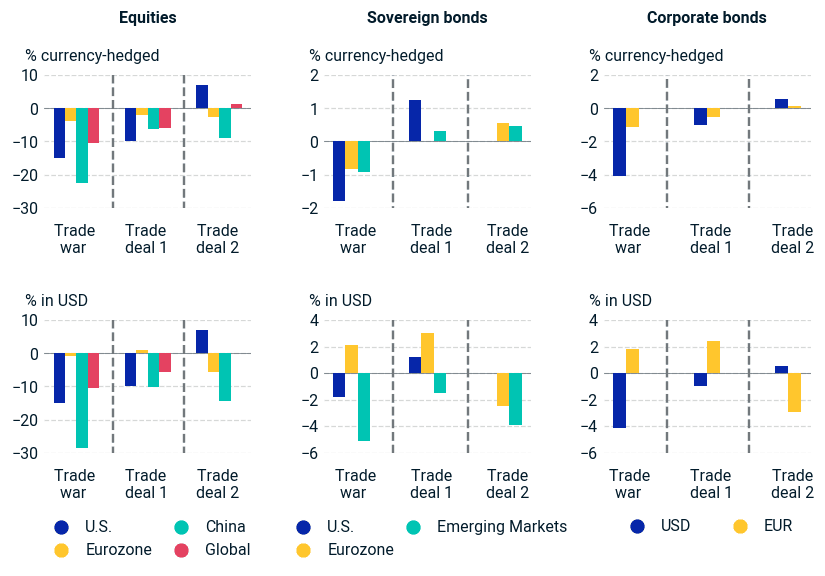
  • In one stress-test scenario, an escalation in the trade war could weaken the yuan by another 8% and cause 25% and 15% losses in the Chinese and U.S. equity markets, respectively.
  • In both scenarios where China and the U.S. agree on a trade deal and reduce the bilateral trade deficit, sovereign bonds could moderately gain. For other asset classes, it would depend on the details.
Markets are cautiously watching how the U.S.-China trade dispute could affect the global economy. Indeed, the International Monetary Fund has recently revised its growth forecast downward as the retaliations have negatively impacted business confidence and investment.1 The IMF published a working paper earlier this year sketching three potential scenarios for U.S.-China trade tensions: an escalating trade war and two trade-deal scenarios in which the U.S.-China bilateral deficit is managed artificially.2 Based on these narratives, we defined three stress tests for hypothetical equity, sovereign and corporate-bond portfolios.3 Under these scenarios, the U.S. equity-market returns range from -15% to +7%, while losses on Chinese equities range between 25% and 7%. The yuan weakens in all scenarios.
Market turbulence has accompanied political uncertainty
Since March 2018, when the U.S. introduced tariffs on steel and aluminum, the yuan fell by more than 10% against the dollar, and the MSCI China Index consistently underperformed the MSCI USA Index and MSCI World ex USA Index, as the exhibit below shows.
Key events in the US-China trade war drove market movements
Key events in the U.S.-China trade dispute: 1) U.S. imposes tariffs on Chinese steel and aluminium imports; 2) U.S. announces further plans to impose 25% tariffs on USD 50 billion to 60 billion of Chinese goods; 3) China and the U.S. agree on the first sketch of a trade deal; 4) despite the agreement, U.S. releases a list of goods subject to new tariffs; 5) U.S. announces it will impose 10% tariffs on an additional USD 200 billion worth of Chinese products; 6) U.S. and China agree on postponing tariff increases at the G20 Argentina summit; 7) U.S. threatens to increase the 10% tariffs to 25%; 8) U.S. announces additional 10% tariffs on the remaining USD 300 billion of Chinese goods, and the yuan falls to its lowest level since the financial crisis; 9) China exempts U.S. pork and soy imports from additional tariffs; and 10) U.S. and China agree tentatively on the first phase of a trade deal.
Three plausible outcomes of US-China trade tensions
A scenario of escalated trade war assumes that the U.S. imposes 25% tariffs on all imports from China, and China in exchange applies the same level of tariffs on all goods imported from the U.S. Rising tariffs could significantly change the current supply chain and lead to increasing inflationary pressure worldwide — which could in turn break the negative bond-equity correlation. Hence, in this scenario our stress test yielded negative results for equities and bonds in all countries. The trade-deal scenarios are basically transactional deals between the U.S. and China; and as a result, the bilateral trade deficit is halved. In the first trade-deal scenario, the Chinese government imposes export tariffs on electronics and other manufactured products bound for the U.S. This intervention leads to lower growth in both the U.S. and China, while sovereign yields slightly decrease. In the second trade-deal scenario, the Chinese government reduces nontariff barriers against U.S. imports and simultaneously increases the same barriers against other trading partners. Although this results in higher growth in the U.S., it hurts all other countries' exports to China and their economies, according to the IMF analysis. All three of our scenarios assume a further weakening of the yuan (see the exhibit below).
The three stress-test scenarios and their simulated market impact4
Applied shocks
Trade war
Trade deal 1: Reduction on Chinese exports to US
Trade deal 2: Increasing Chinese purchases of US goods
Applied shocks

Equity predictive stress test Relative shocks

Trade war

Equity predictive stress test Relative shocks

Trade deal 1: Reduction on Chinese exports to US

Equity predictive stress test Relative shocks

Trade deal 2: Increasing Chinese purchases of US goods

Equity predictive stress test Relative shocks

Applied shocks

U.S. equity

Trade war

-15%

Trade deal 1: Reduction on Chinese exports to US

-10%

Trade deal 2: Increasing Chinese purchases of US goods

+7%

Applied shocks

China equity

Trade war

-25%

Trade deal 1: Reduction on Chinese exports to US

-7%

Trade deal 2: Increasing Chinese purchases of US goods

-10%

Applied shocks

DM ex U.S. equity

Trade war

-4%

Trade deal 1: Reduction on Chinese exports to US

-2%

Trade deal 2: Increasing Chinese purchases of US goods

-3%

Applied shocks

Interest-rate predictive stress test Absolute shocks in basis points

Trade war

Interest-rate predictive stress test Absolute shocks in basis points

Trade deal 1: Reduction on Chinese exports to US

Interest-rate predictive stress test Absolute shocks in basis points

Trade deal 2: Increasing Chinese purchases of US goods

Interest-rate predictive stress test Absolute shocks in basis points

Applied shocks

USD 10-year govt.

Trade war

+30 bps

Trade deal 1: Reduction on Chinese exports to US

-20 bps

Trade deal 2: Increasing Chinese purchases of US goods

0 bps

Applied shocks

CNY 10-year govt.

Trade war

+30 bps

Trade deal 1: Reduction on Chinese exports to US

-10 bps

Trade deal 2: Increasing Chinese purchases of US goods

-15 bps

Applied shocks

EUR 10-year govt.

Trade war

+15 bps

Trade deal 1: Reduction on Chinese exports to US

0 bps

Trade deal 2: Increasing Chinese purchases of US goods

-10 bps

Applied shocks

Credit stress test Relative shocks

Trade war

Credit stress test Relative shocks

Trade deal 1: Reduction on Chinese exports to US

Credit stress test Relative shocks

Trade deal 2: Increasing Chinese purchases of US goods

Credit stress test Relative shocks

Applied shocks

U.S. credit spreads

Trade war

+30%

Trade deal 1: Reduction on Chinese exports to US

+30%

Trade deal 2: Increasing Chinese purchases of US goods

-7%

Applied shocks

EM credit spreads

Trade war

+45%

Trade deal 1: Reduction on Chinese exports to US

+20%

Trade deal 2: Increasing Chinese purchases of US goods

+15%

Applied shocks

DM ex U.S. credit spreads

Trade war

+12%

Trade deal 1: Reduction on Chinese exports to US

+12%

Trade deal 2: Increasing Chinese purchases of US goods

+7%

Applied shocks

Currency predictive stress test Relative shocks

Trade war

Currency predictive stress test Relative shocks

Trade deal 1: Reduction on Chinese exports to US

Currency predictive stress test Relative shocks

Trade deal 2: Increasing Chinese purchases of US goods

Currency predictive stress test Relative shocks

Applied shocks

CNY/USD

Trade war

-8%

Trade deal 1: Reduction on Chinese exports to US

-4%

Trade deal 2: Increasing Chinese purchases of US goods

-6%

Applied shocks

EUR/USD

Trade war

+3%

Trade deal 1: Reduction on Chinese exports to US

+3%

Trade deal 2: Increasing Chinese purchases of US goods

-3%

Trade-war scenario shows negative effect on all markets; trade-deal scenarios showed benefits for some markets
After implementing the stress tests in MSCI's RiskMetrics® RiskManager® and looking at the results from a local-currency perspective, we found that Chinese and eurozone equities lose in all scenarios, while U.S. equity markets gain in the second trade-deal case — when U.S. exports to China increase. Due to rising inflation and the bond-equity correlation's turning positive in an escalating trade war, sovereign fixed income, primarily in the U.S., accumulates significant losses. In the deal scenarios, however, government bonds gain in all markets. Like equities, corporate fixed income suffers from market-value losses, as credit spreads widen and yields increase in the trade-war scenario. In the case of a trade deal, credit loses in the first scenario but gains slightly in the second.
Returns of selected asset classes under the three scenarios
We approximated the hypothetical global-equity portfolio with the MSCI ACWI Index (then looked at a country breakdown) and the eurozone-equity portfolio with the MSCI European Economic and Monetary Union (EMU) Index. The hypothetical U.S. and euro sovereign-bond portfolios are proxied by the Markit iBoxx USD Treasuries Index and the Markit iBoxx EUR Eurozone Index, respectively. The emerging-market sovereign-bond portfolio, and the U.S. and euro corporate-bond portfolios were constructed by the authors, using globally accepted selection criteria.
Stressed out?
We stress tested three scenarios that may help investors understand different possible outcomes. Our analysis suggests that all financial markets could be hurt if the U.S. and China cannot put an end to the trade war. In both cases of a trade deal, the impact could depend on the details of the agreement. The authors thank Oleg Ruban and Jeffrey Ho for their contributions to this post.
Further Reading

Subscribe today
to have insights delivered to your inbox.

1Giles, C. “IMF slashes global growth forecast on trade war fears.” , Oct. 15, 2019.2Caceres, C., Cerdeiro, D., and Mano, R. “Trade Wars and Trade Deals: Estimated Effects using a Multi-Sector Model.” International Monetary Fund, June 2019.3Our stress test starts with making assumptions about broad market aggregates, as shown in the second exhibit. We then apply MSCI’s predictive stress-testing framework to propagate the main assumptions to all other risk factors impacting returns. The results shown in the third exhibit are generated based on this methodology, using MSCI's RiskMetrics® RiskManager®. Our assumptions of broad market aggregates are based on the narrative in the IMF working paper and have been informed by our analysis of historical data, but there is no historical period that exactly corresponds to our assumptions.4MSCI clients can access these scenarios on MSCI's client-support site. These scenarios can then be used in MSCI's BarraOne® and RiskMetrics® RiskManager®.

The content of this page is for informational purposes only and is intended for institutional professionals with the analytical resources and tools necessary to interpret any performance information. Nothing herein is intended to recommend any product, tool or service. For all references to laws, rules or regulations, please note that the information is provided “as is” and does not constitute legal advice or any binding interpretation. Any approach to comply with regulatory or policy initiatives should be discussed with your own legal counsel and/or the relevant competent authority, as needed.