Tariffs Have Strained Bond Markets — and Created Opportunities
Key findings
- Bond-market dislocations, as measured by yield dispersion around issuer curves, have risen since the onset of tariff tensions, but remain well below peaks observed during the COVID-19 market turmoil and global financial crisis (GFC).
- The rate of increase in dislocations is comparable only to that during the COVID-19 crisis and the GFC, however.
- Dislocation reflects both illiquidity and mispricing. If current trends persist, bonds may become increasingly difficult to trade, while alpha/mispricing opportunities could emerge for bond managers and traders prepared to capture them.
While headline tariff risk has been dominated by equity levels and Treasury yields, stress in fixed-income markets is also evident in the mispricing of bonds relative to the curve. Dislocation metrics such as this have increased 30% to 50% since the start of the tariff turmoil, indicating rising frictions in pricing and liquidity. Although overall levels remain below previous crisis peaks, the speed of this move is unusual — comparable only to the speed seen during the COVID-19 crisis and 2008 global financial crisis (GFC).
In the corporate-bond market, a sharp spike in dislocation during COVID-19 caused the Federal Reserve to intervene as a buyer of corporate bonds. Whether similar intervention will be necessary this time remains to be seen. In the Treasury market, recent dislocation may be linked to the unwinding of basis trades, commonly cited as potential drivers of Treasury-market instability.[1]
For fixed-income managers, these developments signal both accelerating liquidity risk and alpha opportunities, especially for those who can quantify and act on dislocation signals.
Mispricing in the Treasury market
Over the past two decades, the Treasury market has experienced several episodes of significant mispricing (see the chart below), the most extreme occurring during the GFC from 2008 to 2009. The second-largest spike emerged as the U.S. exited its zero-interest-rate regime beginning in 2022, with elevated levels persisting for an extended period.
The root causes of each episode are likely unique to each period. The GFC caused significant turmoil in nearly all aspects of the financial world. The tightening cycle starting in 2022 was more specific to the Treasury market as it involved significant moves in both the level and shape of the Treasury curve, and Treasury yields have remained volatile since.
In the current market, the unwinding of several basis trades involving Treasurys may have contributed to Treasury-market volatility by reducing the market share of arbitrageurs who normally trade away market inefficiencies.
Treasury-market dislocation has risen rapidly, but remains lower than past peaks

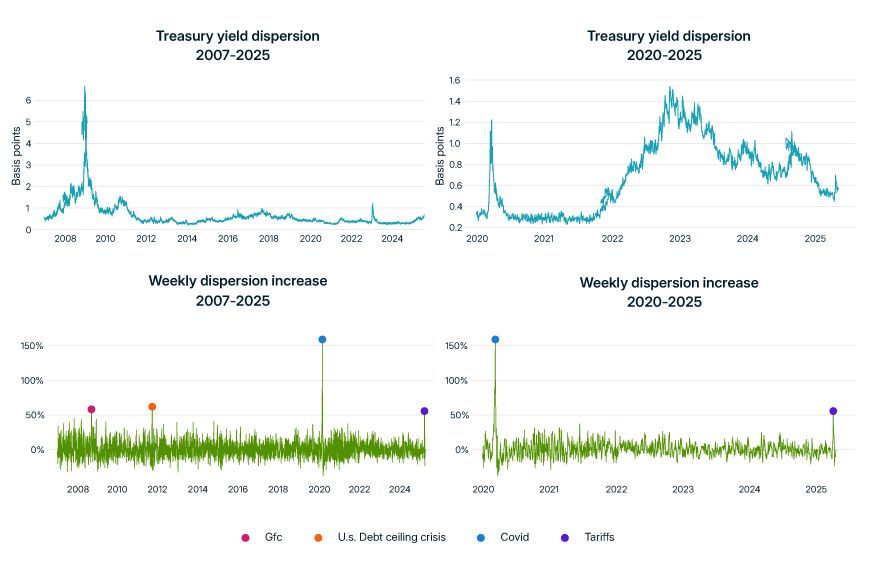
Dislocation is measured by the dispersion of individual Treasury yields around the MSCI Treasury curve. It is defined as the median absolute deviation of the curve yield minus the market yield for a universe of off-the-run Treasurys.
Dislocation in the USD corporate-bond market
The U.S. corporate-bond market has experienced several episodes of significant mispricing over the past 20 years, with the most extreme occurring during the COVID-19 crisis and GFC.
The COVID-19-related spike was particularly sharp in corporate credit, surpassing GFC-era dislocation levels within a matter of weeks. However, it quickly reversed following the Fed's announcement of its corporate bond purchase program. A similar dynamic played out in April 2025, when dislocation spiked in response to President Trump's tariff announcement on April 2, only to retreat sharply after a 90-day pause on tariffs was announced on April 9.
The corporate-bond market is significantly less liquid than the Treasury market and is much more diversified in the number of bonds and issuers. The lower liquidity is reflected in higher levels of dispersion relative to Treasurys (see the chart below). The greater diversification means a larger number of potential signals — at least one for each issuer. MSCI estimates issuer curves for a large percentage of the corporate-bond universe, which we use to derive the dislocation measures below.
Corporate-bond dislocation has risen rapidly, but is low compared to past peaks

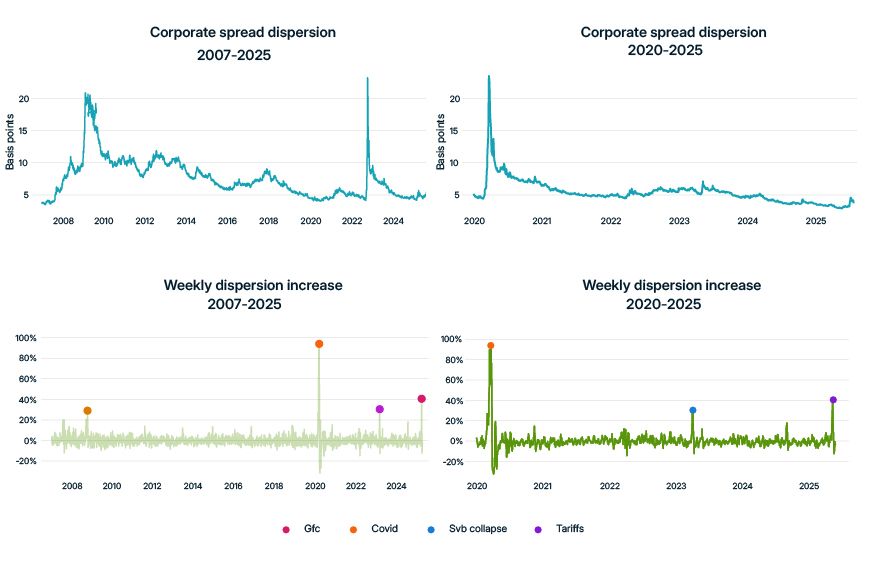
Dislocation is measured by the dispersion of individual corporate-bond spreads around the MSCI Issuer Curve. It is defined as the median absolute deviation of the curve spread minus the market spread for a universe of liquid corporate bonds.
What comes next?
The current turmoil is caused by rapidly changing macro outlooks informed in real-time by abrupt tariff-policy changes. If the uncertainty around tariffs persists, markets may continue to deteriorate, and it is plausible that market dislocation could continue its unusually rapid increase — and reach significantly higher levels.
The author thanks Matteo Petrovich for his contributions to this blog post.

Subscribe todayto have insights delivered to your inbox.
1 These are the swap-spread trade, bond-futures/cash-basis trade and on-the-run/off-the-run trade.
The content of this page is for informational purposes only and is intended for institutional professionals with the analytical resources and tools necessary to interpret any performance information. Nothing herein is intended to recommend any product, tool or service. For all references to laws, rules or regulations, please note that the information is provided “as is” and does not constitute legal advice or any binding interpretation. Any approach to comply with regulatory or policy initiatives should be discussed with your own legal counsel and/or the relevant competent authority, as needed.