The What and the When Matter for the Losses of Real-Estate Lenders
Blog post
October 11, 2024
Key findings
- Not every commercial-real-estate lender in the U.S. is at risk following the sharp downturn in prices since 2022. The timing of loan originations and the type of properties used as collateral are key factors in estimating losses.
- Lenders who originated loans late in the cycle, such as debt funds, tended to have larger unrealized losses on the underlying collateral.
- Investors monitoring the risk of lender losses, and commercial-property investors eager to identify opportunities, would be well served to examine the details for each lender rather than rely on generalizations or previous crises.
Not every lender in U.S. commercial real estate (CRE) is at risk over their exposure to the sector. Many originated loans that are still performing even with the drops in prices since 2022. The point in the cycle at which lenders originated loans along with conservative underwriting is keeping many lenders above water.
Still, the sharp price decline has raised bad memories in the CRE industry. Old-timers working in the aftermath of the savings-and-loan crisis remember the sharp drop in prices and bank failures. More recent memories of the 2008 global financial crisis raise fears of the debt-market illiquidity that accompanied the price collapse in that cycle. Each cycle is different, however, and aiming to understand lender performance in this cycle using examples from the past misses the mark.
To really understand the risks a lender faces from unrealized losses on collateral, one must look at the actual loans that these groups originated.[1] We took a set of about 6,400 lenders from the MSCI Mortgage Debt Intelligence database and marked the underlying pool of collateral to market value as at Q2 2024. This mark to market was done by increasing or decreasing the value at origination using the hedonic price index most relevant to the property type and location. A weighted origination date was also calculated for each lender.[2]
Unrealized collateral losses more apparent for lenders later in the cycle
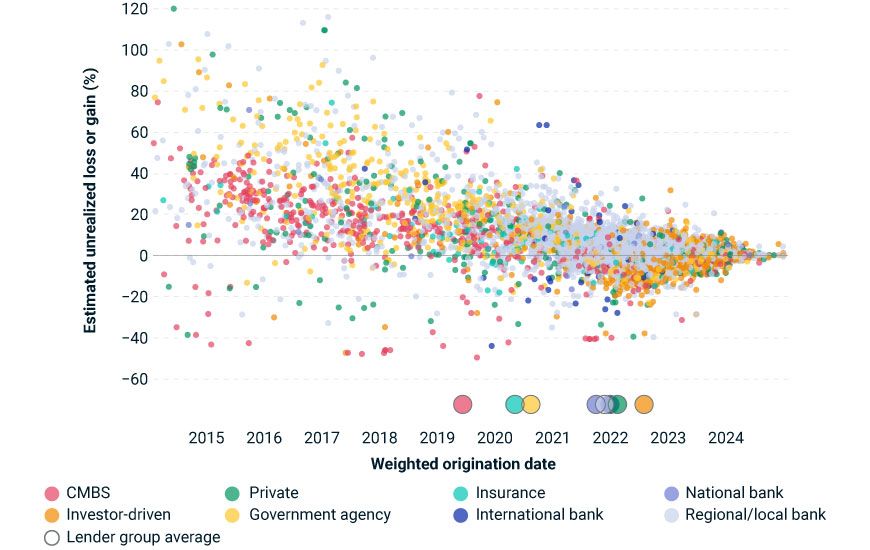
The percentage estimated unrealized gain or loss reflects the gain or loss as a proportion of the lender's portfolio collateral. Each dot represents a lender. For readability, y-axis is truncated at 120%. Hedonic pricing data as of Q2 2024. Loan data source: MSCI Mortgage Debt Intelligence.
It is clear that lenders who had originated more loans late in the cycle tend to have a larger (more negative) unrealized loss on collateral. The lender group that stands out is the investor-driven group, a category that includes debt funds and other financial lenders. Banks in general also originated more loan volume later (2021 onward).
The timing for CMBS lenders is different. Given that the majority of these outstanding loans were originated prior to 2020, CMBS lenders tended to have more positive unrealized gains. Such loans should be easier to work with when it is time to refinance.
Timing mattered a lot for some property types
The second story of interest from the analysis is the property-type exposure. We rolled up the unrealized losses or gains for each property sector based on the year and quarter of origination. As the exhibit below shows, the intersection of sector and timing will also help determine the degree of losses for the underlying collateral.
Apartment market flipped from collateral gains to losses
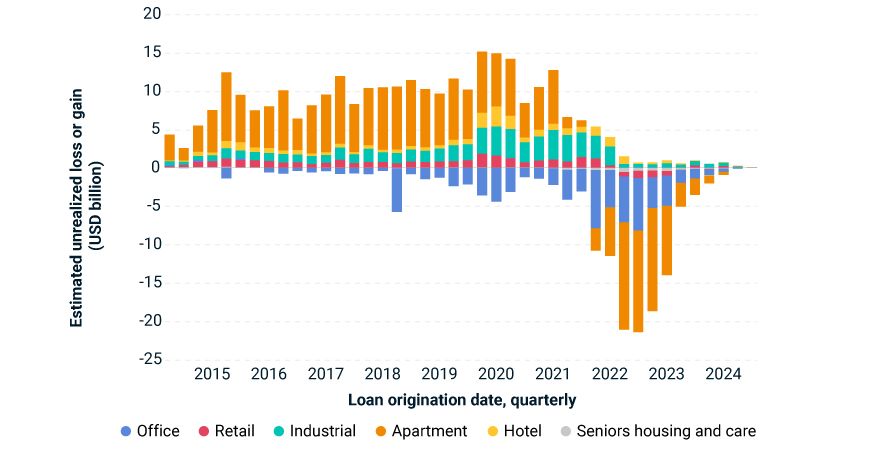
Hedonic pricing data as of Q2 2024. Loan data source: MSCI Mortgage Debt Intelligence.
For industrial property across all vintage periods there remains unrealized gains. By contrast, price-growth declines have resulted in unrealized losses across most vintage periods for office, even for loans originated well before the pandemic. Apartments are a sector where origination timing clearly mattered a lot. Apartment loans originated before Q3 2021 are showing unrealized gains whereas originations after that date largely show unrealized losses.
The decline in commercial property prices since 2022 is not a case of history repeating. It is mostly a one-time shock to the system from interest rates moving up from record-low levels. The office sector is different, though, with ongoing structural changes to the income potential for the assets. Some of the challenges to the financial sector from the decline in CRE prices might rhyme with elements of previous downturns but this downturn is different. Trying to understand the current risks looking only at the past without getting into the details of each lender will lead one to make bad decisions about the present.


Subscribe todayto have insights delivered to your inbox.
1 According to the MSCI Real Capital Analytics database, no sale of the associated collateral has occurred and as such any loss on the loan has not been realized as of Q2 2024.2 The weighted-average origination date was calculated for each lender by weighting each loan's origination date by the collateral value of the loan at origination as a share of the lender's total portfolio.
The content of this page is for informational purposes only and is intended for institutional professionals with the analytical resources and tools necessary to interpret any performance information. Nothing herein is intended to recommend any product, tool or service. For all references to laws, rules or regulations, please note that the information is provided “as is” and does not constitute legal advice or any binding interpretation. Any approach to comply with regulatory or policy initiatives should be discussed with your own legal counsel and/or the relevant competent authority, as needed.