Viewing Risk from any Altitude
Blog post
June 24, 2015
Some large institutional investors prefer the granularity of a bottom‐up factor model – the way risk is allocated across markets, styles, issuers and industries – while others may prefer a more aggregated view. These investors would rather decompose risk into a few broad themes, such as by grouping fixed-income risk across markets into a level and a slope factor.
For example, an asset allocation strategist or CIO typically thinks of allocating to several broad risk sources, such as equity, credit, rates, inflation and commodities, rather than the individual factors in a model like the Barra Integrated Model (BIM).
To that end, we launched our new Macro Factor model in , which allows institutional investors to have both views. They will now be able to both "zoom out" to the desired level for top level decision making, while retaining the benefits of a granular factor model for the risk analyst or portfolio manager.
These Macro Factors provide investors with a simpler, more economical risk forecast that is based on, and fully consistent with, the Barra Integrated Model (BIM).
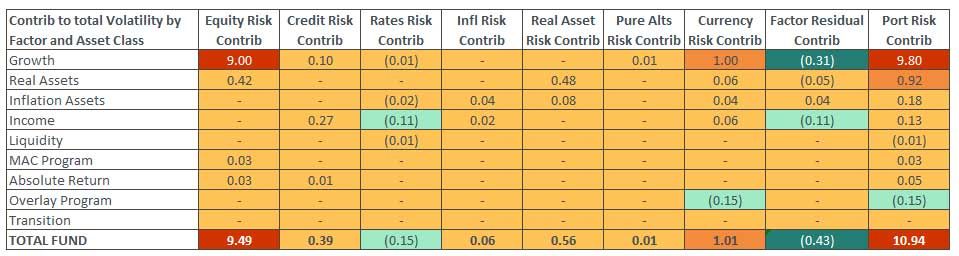
In the exhibit below, we can see that the Macro Factors approach is both revealing and intuitive. In this figure, when we take this more "macro" approach to an actual client portfolio, we see that there is a strong correspondence between the client's approach to asset allocation and the Macro Factors. In other words:
- Equity risk is concentrated in the Growth portfolio.
- Most of the currency risk comes from unhedged foreign equity.
- The Real Assets portfolio has its risk coming from Equity and Real Assets factors in equal measure. Real Assets risk factors are split between Real Assets and Inflation‐sensitive where the client has placed their Commodity program.
- Credit, Rates and Inflation factors are concentrated in Fixed Income. The Overlay program, as expected, reduces currency risk by 15 basis points.
- Most of the risk of private equity and hedge funds is attributed to public equity factors.
Risk contribution by asset class and macro factor
(Values are annualized standard deviation in percent)

Subscribe todayto have insights delivered to your inbox.
The content of this page is for informational purposes only and is intended for institutional professionals with the analytical resources and tools necessary to interpret any performance information. Nothing herein is intended to recommend any product, tool or service. For all references to laws, rules or regulations, please note that the information is provided “as is” and does not constitute legal advice or any binding interpretation. Any approach to comply with regulatory or policy initiatives should be discussed with your own legal counsel and/or the relevant competent authority, as needed.