What scenarios has the US equity market priced in?
Blog post
March 13, 2020
- Does the U.S. equity-market decline reflect a panicked overreaction or economic fundamentals?
- We reverse stress test the recent market drop, to explore which scenarios for short- and long-term growth expectations and changes in the equity risk premium explain the recent downturn.
- We find that, while much is unknown, the market has already priced in a large economic downturn with room for a price recovery if risk premia subside.
Four scenarios that could explain recent market repricing
To understand these questions, we use a model relating equity prices and macroeconomic variables to reverse stress test the recent U.S. equity-market returns. The discounted-cash-flow model connects the price of equity to factors driving the expected future cash flows and how they are discounted to reflect their present value. Three factors are most relevant:
- Short-term growth: How will the pandemic change economic growth over the next year or so?
- Long-term growth expectations: How has the pandemic changed the longer-term trend growth rate? As shown in the figure below, this factor represents shocks whose impact persists for many years, while gradually returning to the previous growth path.
- Risk premium: How much do lower equity prices reflect higher required excess returns — or panicked selling — rather than changes in the fundamentals and lower expected cash flows?
Reverse stress testing the coronavirus shock
Scenario | Feb. 21 to March 12 MSCI USA Index | Change in short-term growth rate | Change in long-term growth rate | Change in risk premium |
|---|---|---|---|---|
Scenario "Fear" | Feb. 21 to March 12 MSCI USA Index -27% | Change in short-term growth rate 0 | Change in long-term growth rate 0 | Change in risk premium + 4.0% |
Scenario "Mild Slowdown" | Feb. 21 to March 12 MSCI USA Index -27% | Change in short-term growth rate -2% | Change in long-term growth rate 0 | Change in risk premium +3.7% |
Scenario "Lasting Recession" | Feb. 21 to March 12 MSCI USA Index -27% | Change in short-term growth rate -5% | Change in long-term growth rate -.5% | Change in risk premium +2.8% |
Scenario "Pure Fundamentals" | Feb. 21 to March 12 MSCI USA Index -27% | Change in short-term growth rate -3.5% | Change in long-term growth rate -3.5% | Change in risk premium 0 |
Values in the shaded cells are outputs of the model; while values in the other cells are inputs. See the figure below for the growth paths of these scenarios.
Growth paths for the economic scenarios
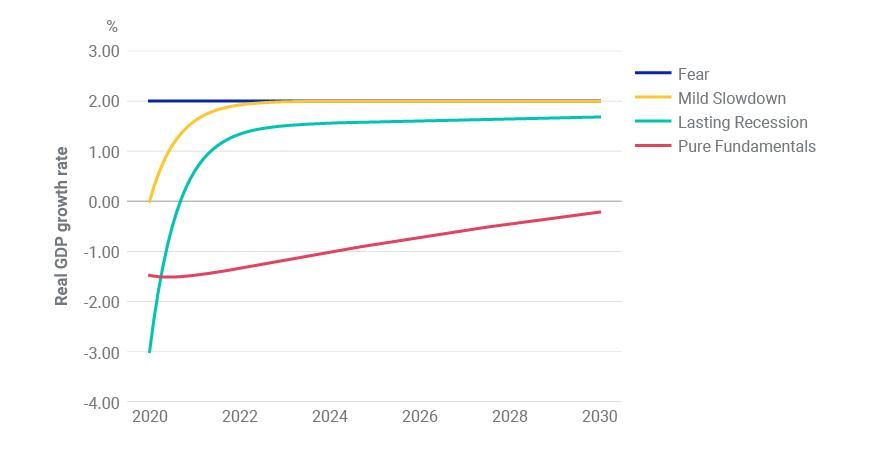
The growth paths for various shock scenarios plotted relative to a 2% annual real growth reference scenario. In the model, a 5% drop in short-term growth expectations and .5% drop in trend would change 2% expected growth to a -3% contraction for 2020. In the absence of a change in trend growth, the economy would recover quickly to the baseline growth rate, but the trend shock in the "Lasting Recession" scenario leads to drag on the economy for the decade ahead.
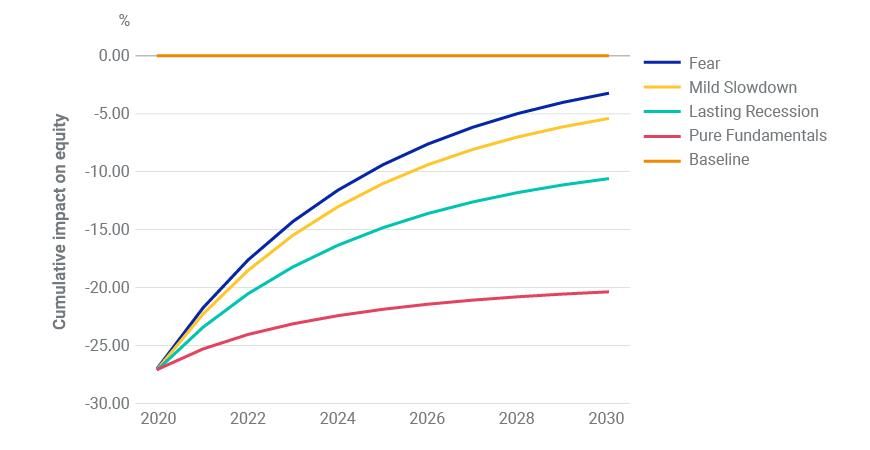
Model cumulative impact on equity returns for the scenarios
Further Reading


Subscribe todayto have insights delivered to your inbox.
The content of this page is for informational purposes only and is intended for institutional professionals with the analytical resources and tools necessary to interpret any performance information. Nothing herein is intended to recommend any product, tool or service. For all references to laws, rules or regulations, please note that the information is provided “as is” and does not constitute legal advice or any binding interpretation. Any approach to comply with regulatory or policy initiatives should be discussed with your own legal counsel and/or the relevant competent authority, as needed.