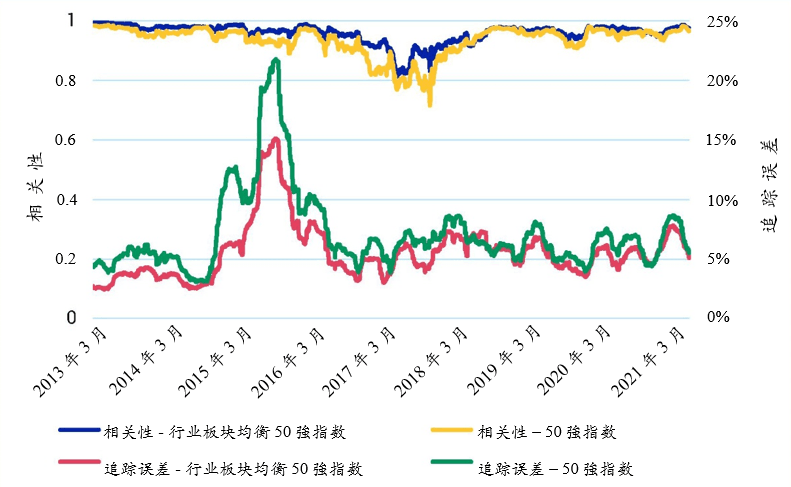
- 简单的50強中国A股投资组合可能导致行业板块权重配置相对于大市而言出现不均衡。这对于以通过持有超大盘股获得均衡市场敞口为目标的投资者带来风险。
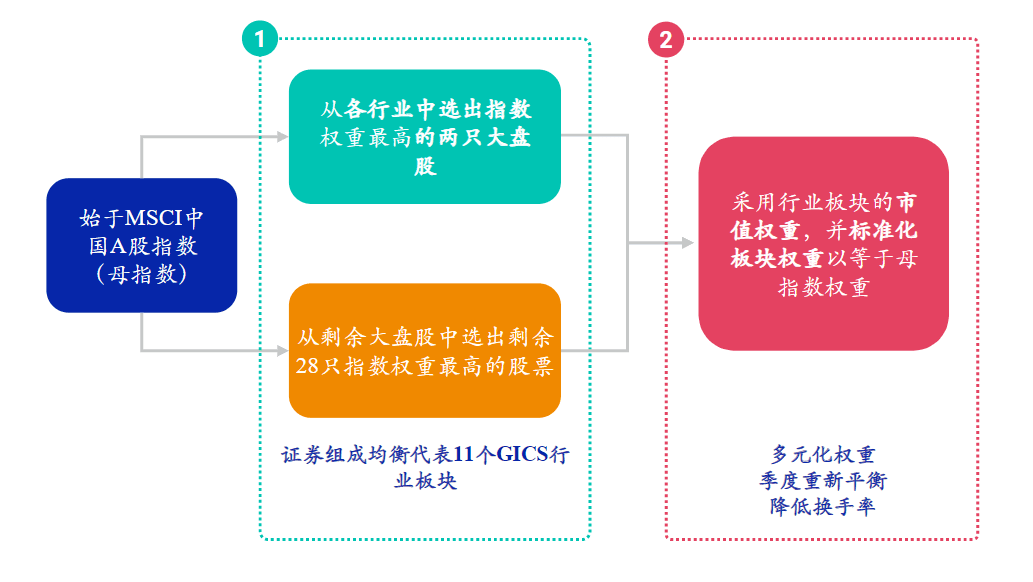
- 我们分析一种创新的行业均衡方法,以取得与市场类似的敞口,这可能有助于投资者在中国A股市场实施战略和战术资产配置。
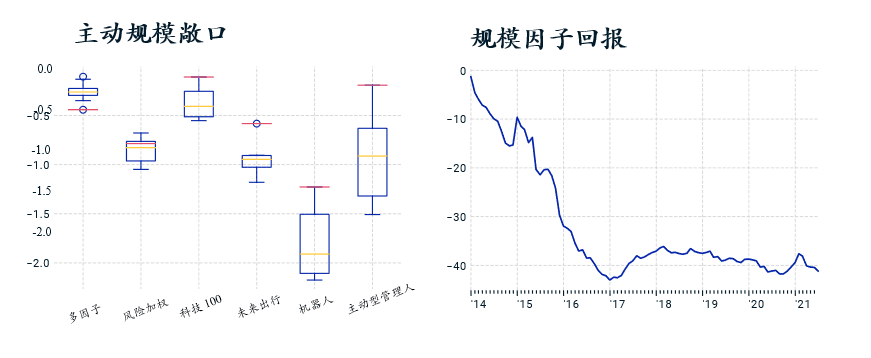
- 这个方法应用于横跨时间区间的不同投资策略,可用作管理中国A股市场风险和规模因子敞口。
MSCI中国A50互联互通指数构建
MSCI中国A50互联互通指数与50強方法的行业板块集中度比较
None | MSCI中国A股指数 | MSCI中国A50 互联互通指数 | 50強 | None |
最大证券权重 | 5.83% | 9.92% | 12.58% | None |
前五大证券权重 | 15.35% | 32.32% | 33.11% | None |
None | 权重 | 数量 | 权重 | 数量 | 权重 | 数量 |
通讯业务 | 1.29% | 12 | 1.35% | 2 | 0.00% | 0 |
非日常生活消费品 | 7.73% | 41 | 7.94% | 4 | 7.13% | 4 |
日常消费品 | 17.90% | 47 | 17.63% | 8 | 29.11% | 9 |
能源 | 1.77% | 13 | 1.64% | 2 | 0.00% | 0 |
金融 | 19.23% | 71 | 18.64% | 14 | 23.15% | 12 |
医疗保健 | 11.83% | 59 | 11.69% | 6 | 11.53% | 6 |
工业 | 14.14% | 72 | 15.90% | 4 | 14.10% | 8 |
信息技术 | 13.02% | 79 | 13.19% | 3 | 7.11% | 5 |
原材料 | 9.22% | 61 | 8.21% | 3 | 4.46% | 4 |
房地产 | 2.12% | 18 | 2.08% | 2 | 1.13% | 1 |
公用事业 | 1.75% | 8 | 1.75% | 2 | 2.29% | 1 |
MSCI中国A50互联互通指数与MSCI中国A股指数的比较
None | MSCI中国A50 互联互通指数 | MSCI中国 A股指数 |
成分股个数* | 50 | 481 |
年化指数换手率** | 27.2% | 17.4% |
成分股的平均自由流通市值 (十亿美元)* | 69.5 | 16.5 |
成分股的平均一个月成交额 (十亿美元)* | 7.3 | 2.5 |
股本回报率 (ROE)** | 14.2% | 12.7% |
治理支柱得分* | 3.8 | 3.5 |


Subscribe todayto have insights delivered to your inbox.
The content of this page is for informational purposes only and is intended for institutional professionals with the analytical resources and tools necessary to interpret any performance information. Nothing herein is intended to recommend any product, tool or service. For all references to laws, rules or regulations, please note that the information is provided “as is” and does not constitute legal advice or any binding interpretation. Any approach to comply with regulatory or policy initiatives should be discussed with your own legal counsel and/or the relevant competent authority, as needed.