Drawdowns Can Have a Silver Lining for Your Taxes
The recent tariff turmoil that has shaken portfolios has also created opportunities for wealth managers and investors to pursue tax-efficient rebalancing through loss harvesting. We found that a systematic, event-driven approach to tax-loss harvesting, compared to a periodic-only approach, could have improved a hypothetical U.S. equity portfolio's after-tax performance by 2.6 percentage points over the last six years — that's 40 basis points (bps) annually.
We simulated and compared two loss-harvesting strategies
Our hypothetical U.S. investor held a U.S. equity portfolio that was initially funded with cash. It was allocated to approximately 250 stocks selected from the roughly 600 constituents of the MSCI USA Index. The initial portfolio had minimal initial tracking error (TE) relative to the index.1
The loss-harvesting approaches we compared were:
- Periodic only — semiannual portfolio rebalances, in June and December, that align with MSCI's semiannual index reviews.
- Periodic and opportunistic — semiannual rebalances, as in the periodic-only strategy, and rebalances following drawdowns of 15% or more in the MSCI USA Index that occurred after the previous rebalancing date.
We found opportunity in the drawdowns
By exploiting these market drawdowns, the periodic-and-opportunistic strategy produced a tax benefit of 8.8% compared to 6.2% for the periodic-only strategy. The former increased the portfolio's after-tax return by 40 bps annually since January 2019.3
So, whereas drawdowns can negatively impact portfolio values, they can also have a silver lining, presenting opportunities for more effective tax-loss harvesting.
The author thanks Thomas Verbraken for his contributions to this quick take.
Simulated opportunistic rebalancing led to higher after-tax performance
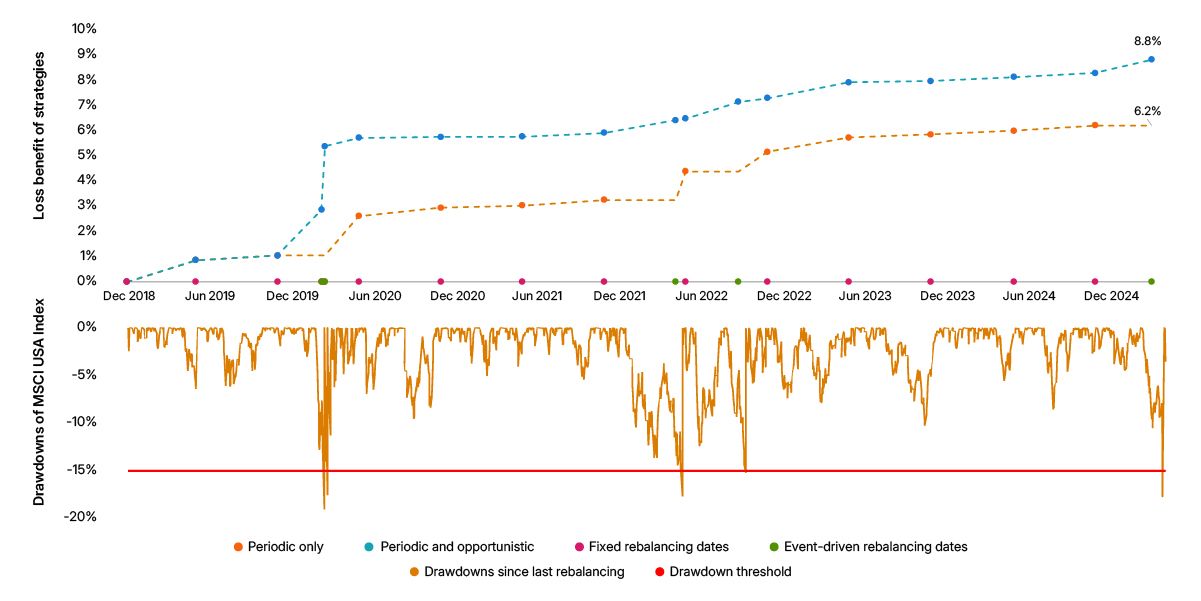
Data from Dec. 31, 2018, to April 10, 2025.

Subscribe todayto have insights delivered to your inbox.
How Tariffs Could Impact Equity Markets: Building Scenarios
Tariff risks are at center stage for investors. To help manage the uncertainty, this blog post shows how revenue-exposure data and a scenario-analysis framework enable equity investors to translate targeted industry assumptions into potential portfolio-level impacts.
Total Portfolio Allocation for Modern Wealth
Traditional asset allocation theories often overlook private assets. We provide a practical blueprint for total portfolio allocation management, focused on a deeper understanding of market correlations to better manage concentration risk and uncertainty in expected returns.
1 Over the full period, the average TE is 60 bps for the periodic-only strategy and 150 bps for the strategy that combines periodic and opportunistic loss harvesting.2 In the periodic-and-opportunistic approach, when the 15% drawdown threshold is breached, we run a tax-loss-harvesting optimization and reset the peak from which the drawdown is calculated to that day’s level.3 After-tax performance was calculated by adjusting pre-tax performance to account for both taxes and the benefits of realized losses. In line with the United States Investment Performance Committee (USIPC) After-Tax Performance Standards promulgated by CFA Institute, taxes have a negative effect on performance, while realized losses can have a positive effect. More frequent rebalancing by taking advantage of drawdowns increased the average annual turnover from 14% to 23%.
The content of this page is for informational purposes only and is intended for institutional professionals with the analytical resources and tools necessary to interpret any performance information. Nothing herein is intended to recommend any product, tool or service. For all references to laws, rules or regulations, please note that the information is provided “as is” and does not constitute legal advice or any binding interpretation. Any approach to comply with regulatory or policy initiatives should be discussed with your own legal counsel and/or the relevant competent authority, as needed.