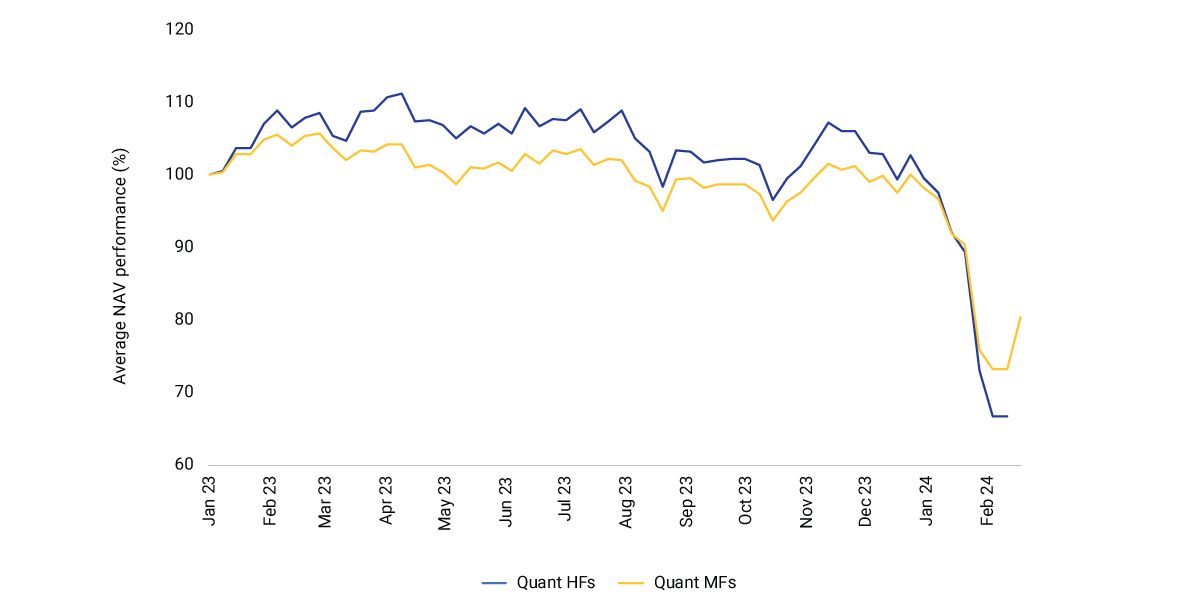
From January to mid-February, some quantitative mutual funds (MF) and hedge funds (HF) in the China-mainland market suffered drastic declines in net asset value (NAV). Meanwhile, the MSCI China A Index recorded a 1.2% YTD gross return in CNY, as of Feb. 23.
A mixture of forces — leverage, crowded long positions in small- and micro-cap stocks and an investor rush into large-cap stocks when the segment demonstrated signs of resilience — appears to have caused this mini liquidity crisis among some quant funds.
Measuring and monitoring crowding risk in China A shares
Comprehensive management of factor risk could help investors mitigate risks from market pressure. For example, using the MSCI Barra China A Total Market Equity Model for Long-Term Investors (CNLTL), we can see that, based on the latest complete holding disclosure as of June 30, 2023,1 that the worst-performing quant MFs' most significant active factor exposure was in small caps relative to the MSCI China A Index. Based on the MSCI Multi-Asset Class Factor Model (MAC.L), small-cap exposure alone explained about 30% of the YTD NAV decline of the top quant-MF laggards.
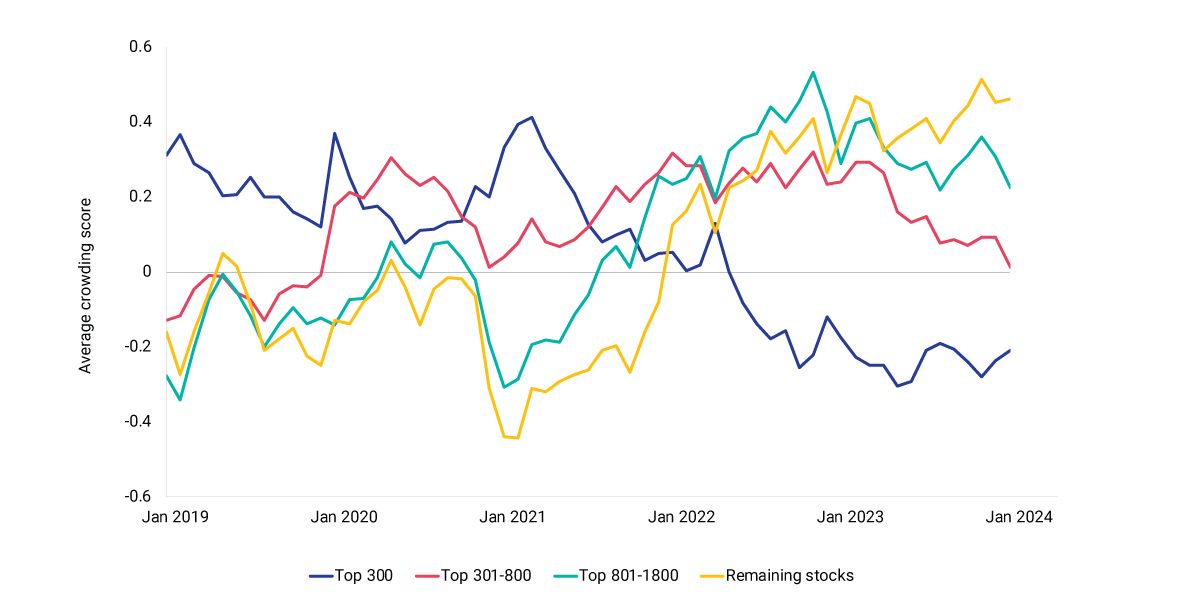
The MSCI Security Crowding Model monitors the crowding profile of stocks globally and can help alert investors to potential crowding risks. The integrated crowding scores — a combination of time-series and cross-sectional crowding metrics — of China stocks showed divergent crowding trends for size segments over the last five years.
Small- and micro-cap stocks have become more crowded over the past two years, while the large-cap space became less crowded. The smallest-stock group outperformed the largest-stock group by 2.6% in 2023. The integrated crowding score of the smallest stocks reached a five-year peak close to the end of 2023, illustrating the current looming crowding risk.
Average performance of top 50 laggards in quantitative funds

The top 50 laggards were selected based on their adjusted NAV-per-share percentage declines for 2024 YTD. For HFs, average NAV performance is as of Feb. 16; for MFs, as of Feb. 23, 2024. Source: Wind, MSCI
Integrated crowding score for MSCI China A International IMI stocks by size

Data are for the period Jan. 31, 2019, to Jan. 31, 2024. The average score of each size group is weighted by the index weight of stocks within that group. The index is the MSCI China A International Investable Market Index (IMI).
Subscribe todayto have insights delivered to your inbox.
1 Mutual funds in the China-mainland market typically release their annual year-end reports, which include the complete holdings list, in March.
The content of this page is for informational purposes only and is intended for institutional professionals with the analytical resources and tools necessary to interpret any performance information. Nothing herein is intended to recommend any product, tool or service. For all references to laws, rules or regulations, please note that the information is provided “as is” and does not constitute legal advice or any binding interpretation. Any approach to comply with regulatory or policy initiatives should be discussed with your own legal counsel and/or the relevant competent authority, as needed.

