Most Prevalent Climate Hazards Found in Asia-Pacific
Hazard data is a key component of MSCI ESG Research's physical-risk modeling. The intensity and frequency of individual hazards strongly depend on the location of the asset and are projected to change over time depending on the underlying climate scenario. We mapped the physical assets operated by the constituents of the MSCI AC Asia Investable Market Index (IMI) to the most prevalent hazards in the region: extreme heat, tropical cyclones and coastal flooding. We used the hazard percentile data from the 3 degrees Remind Nationally Determined Contributions (NDCs) scenario and a 2050 timeline.
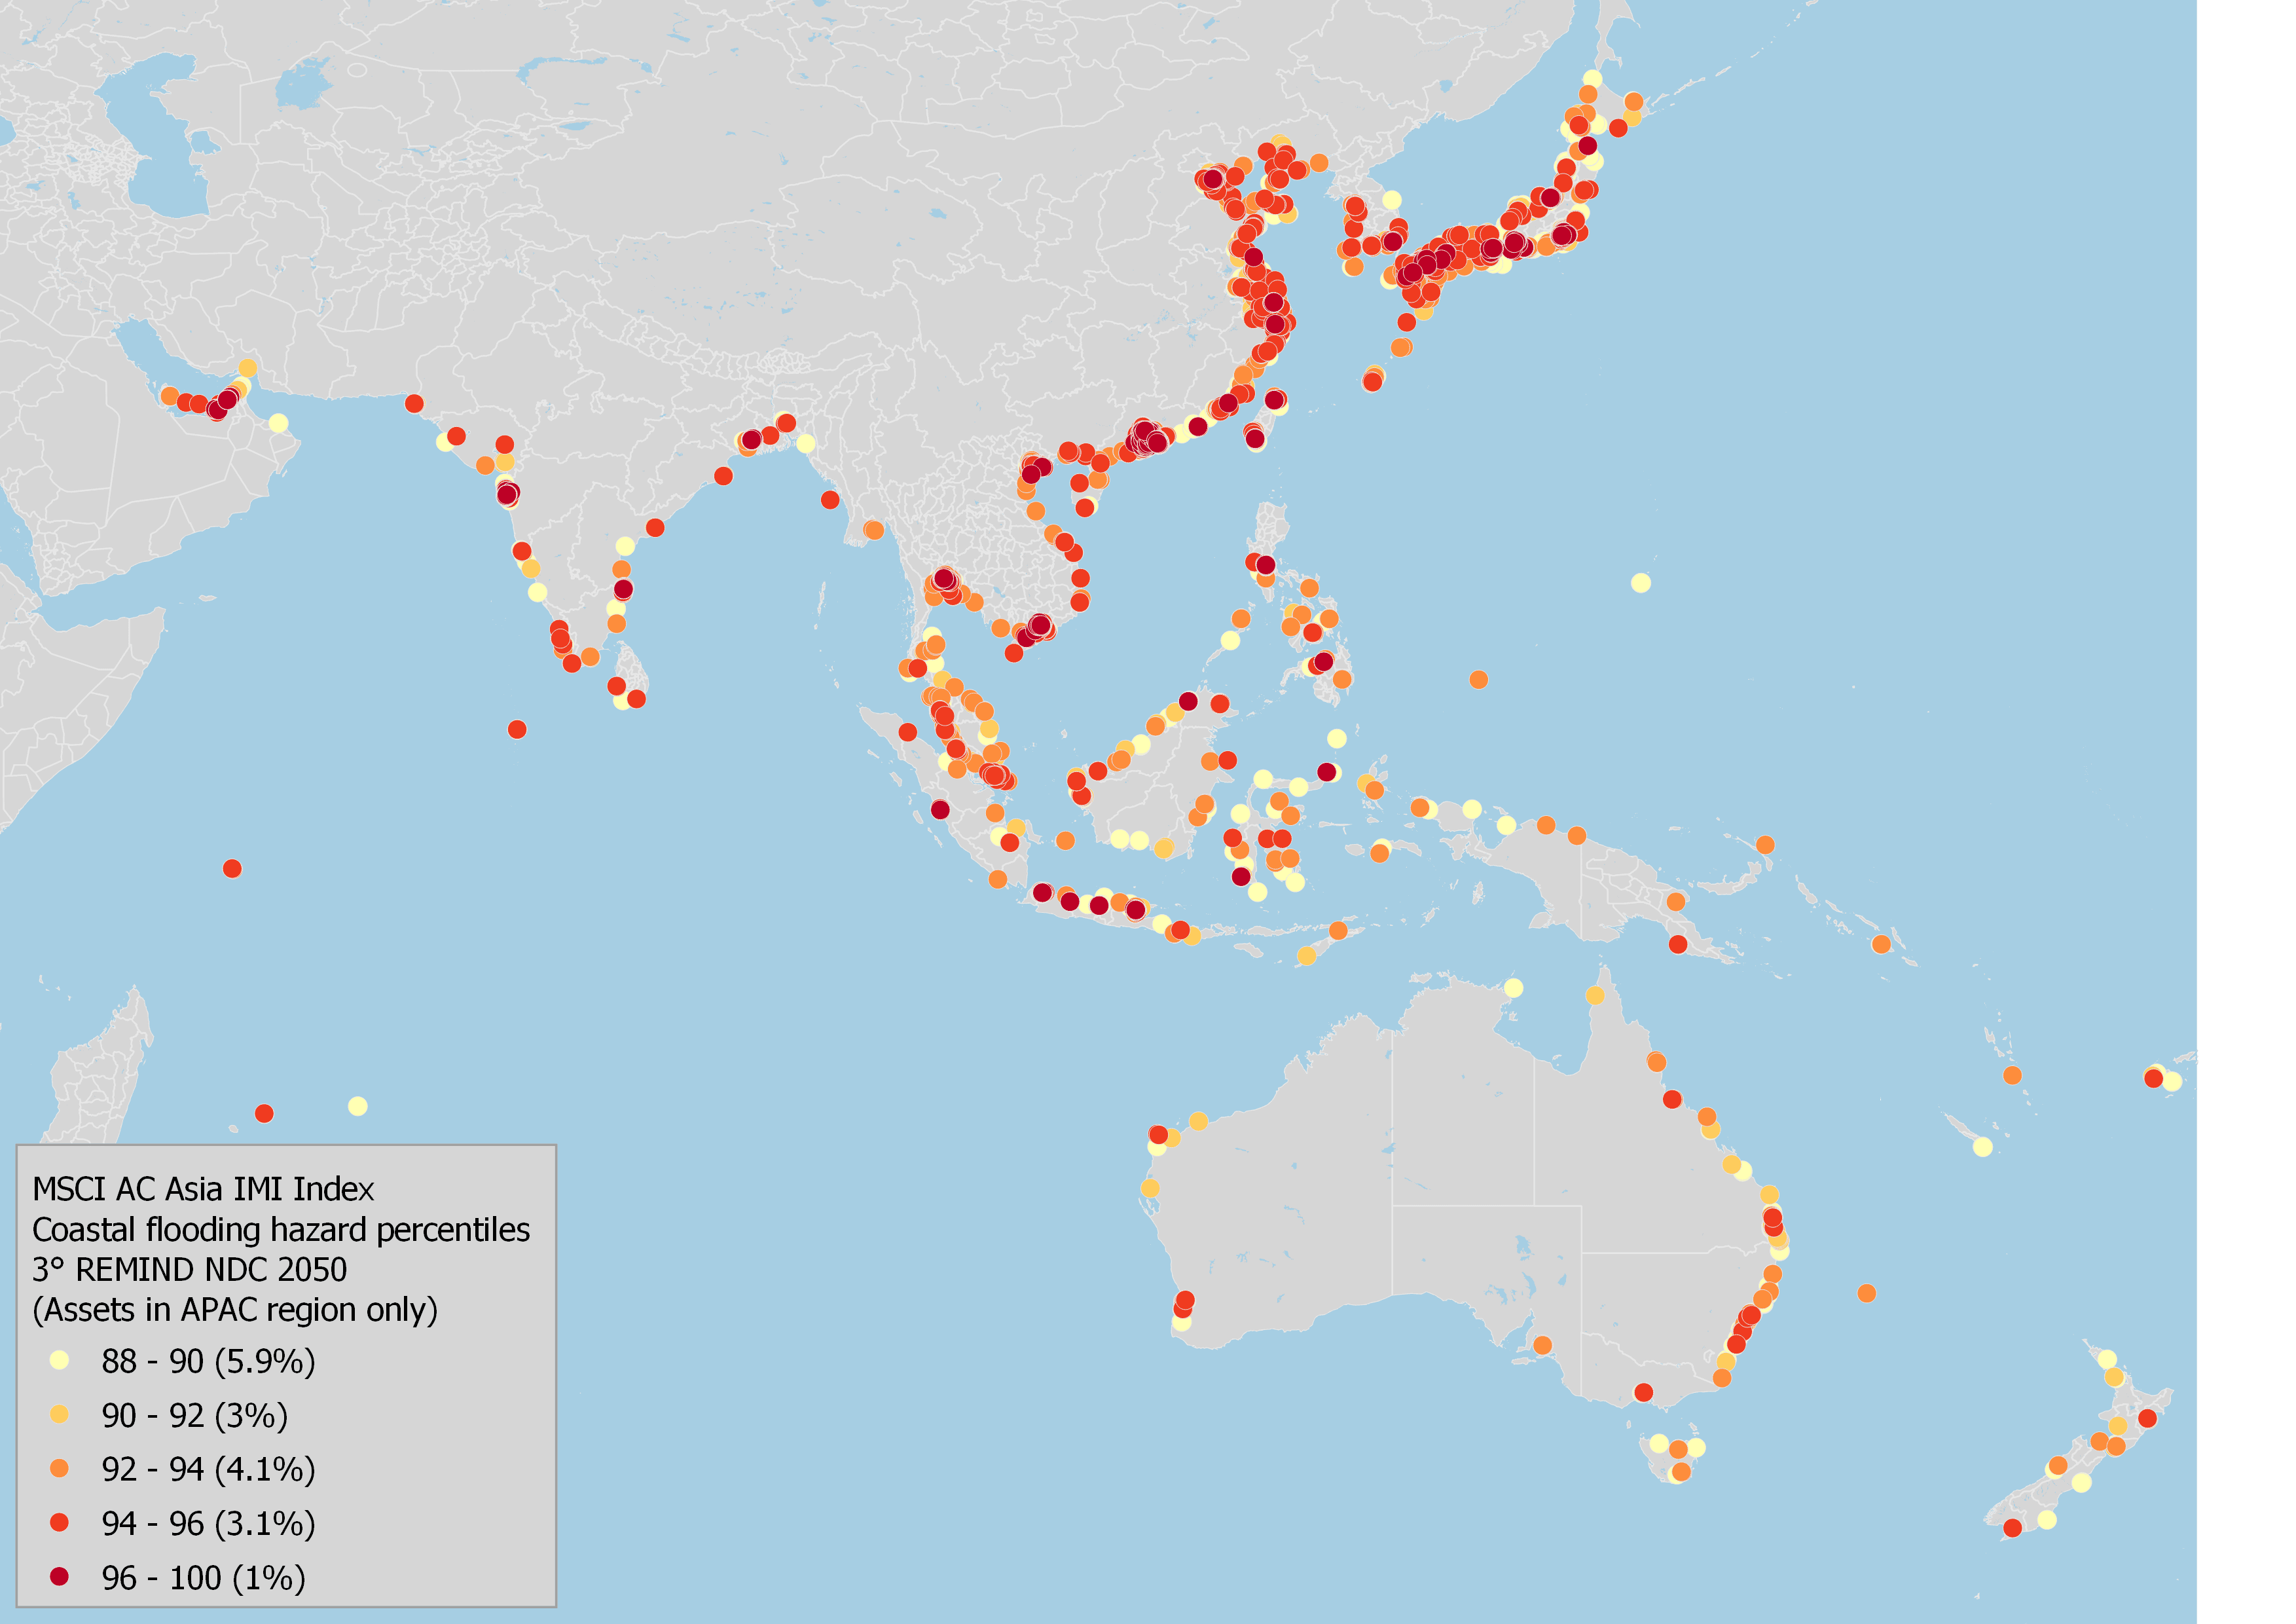
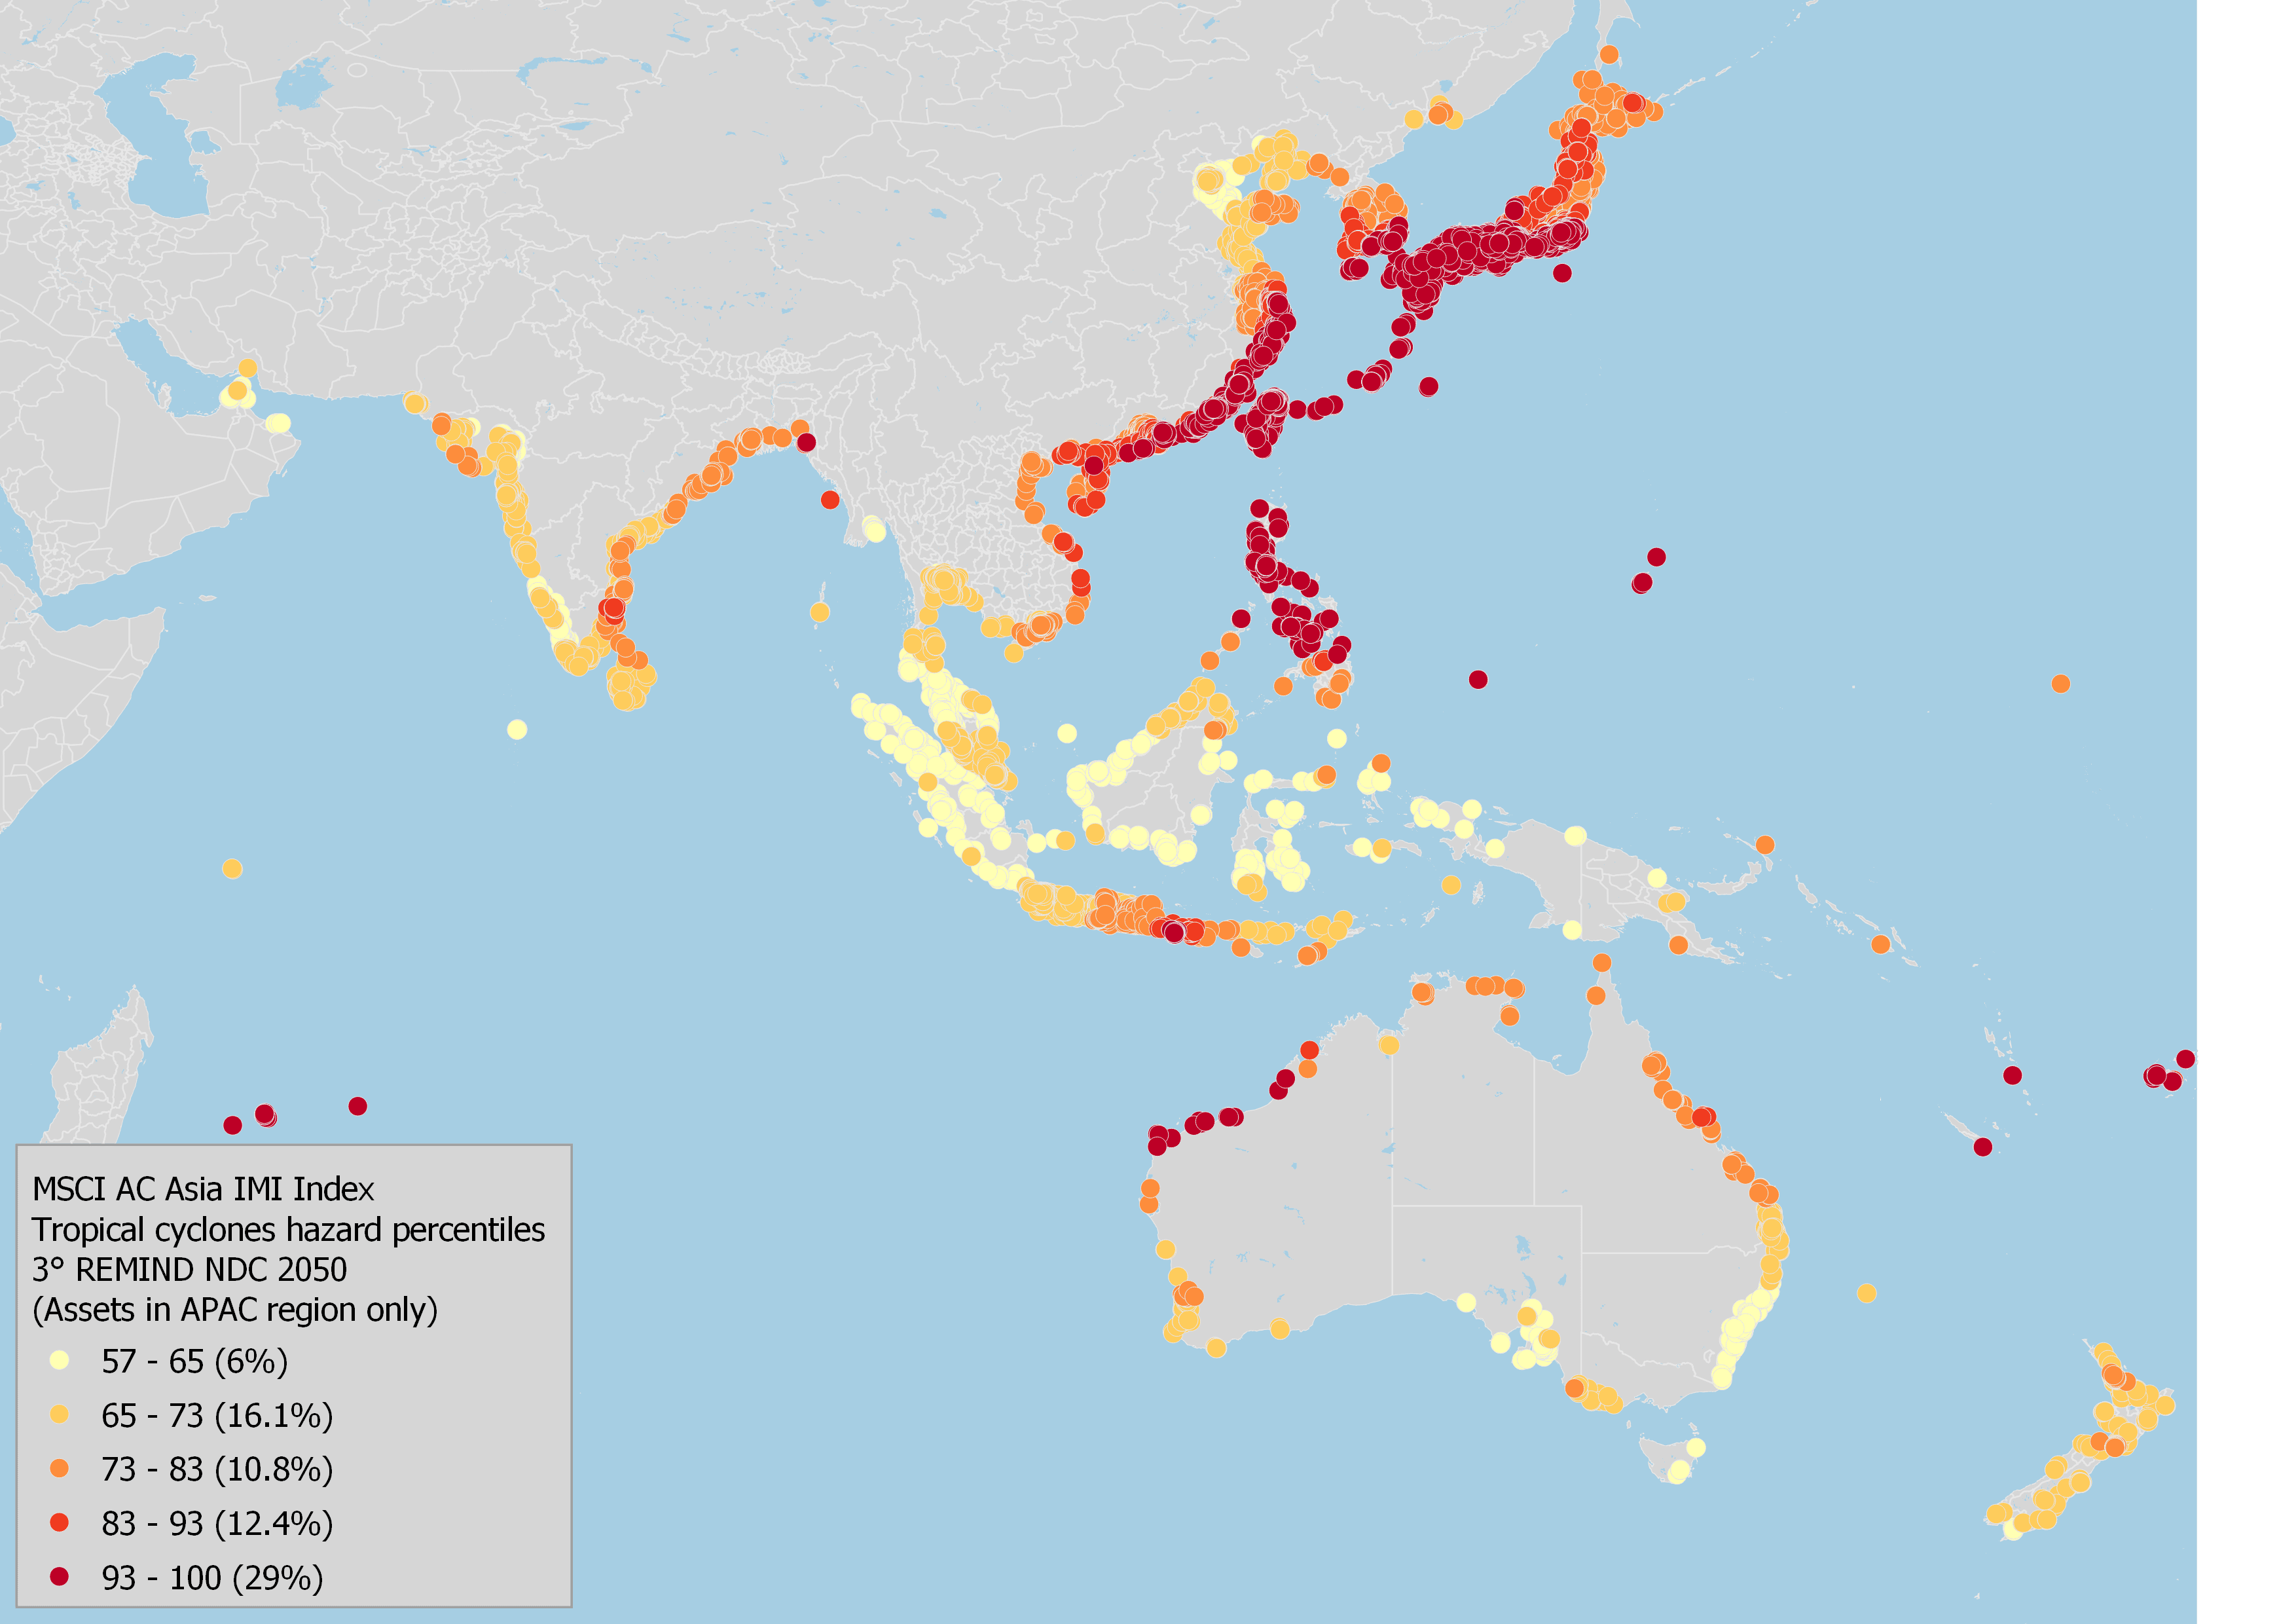
We looked at 82,015 (75%) of the known physical assets operated by the constituents of the MSCI AC Asia IMI located in the APAC region. 17% were exposed to coastal flooding, with assets in Japan and Eastern China the most exposed. 74% were exposed to tropical cyclones, where assets in the Philippines, Japan and the Eastern coast of China had the highest exposure to this hazard. 100% were exposed to extreme heat, with South Asian and Southeast Asian located assets having the highest exposure.
Climate-aware investors may wish to consider the location and exposure to such hazards associated with the physical assets of their holdings when assessing their portfolios.
Coastal flooding hazard percentiles,
3° REMIND NDCs 2050 scenario
Tropical cyclone hazard percentiles,
3° REMIND NDCs 2050 scenario
Extreme heat hazard percentiles,
3° REMIND NDCs 2050 scenario
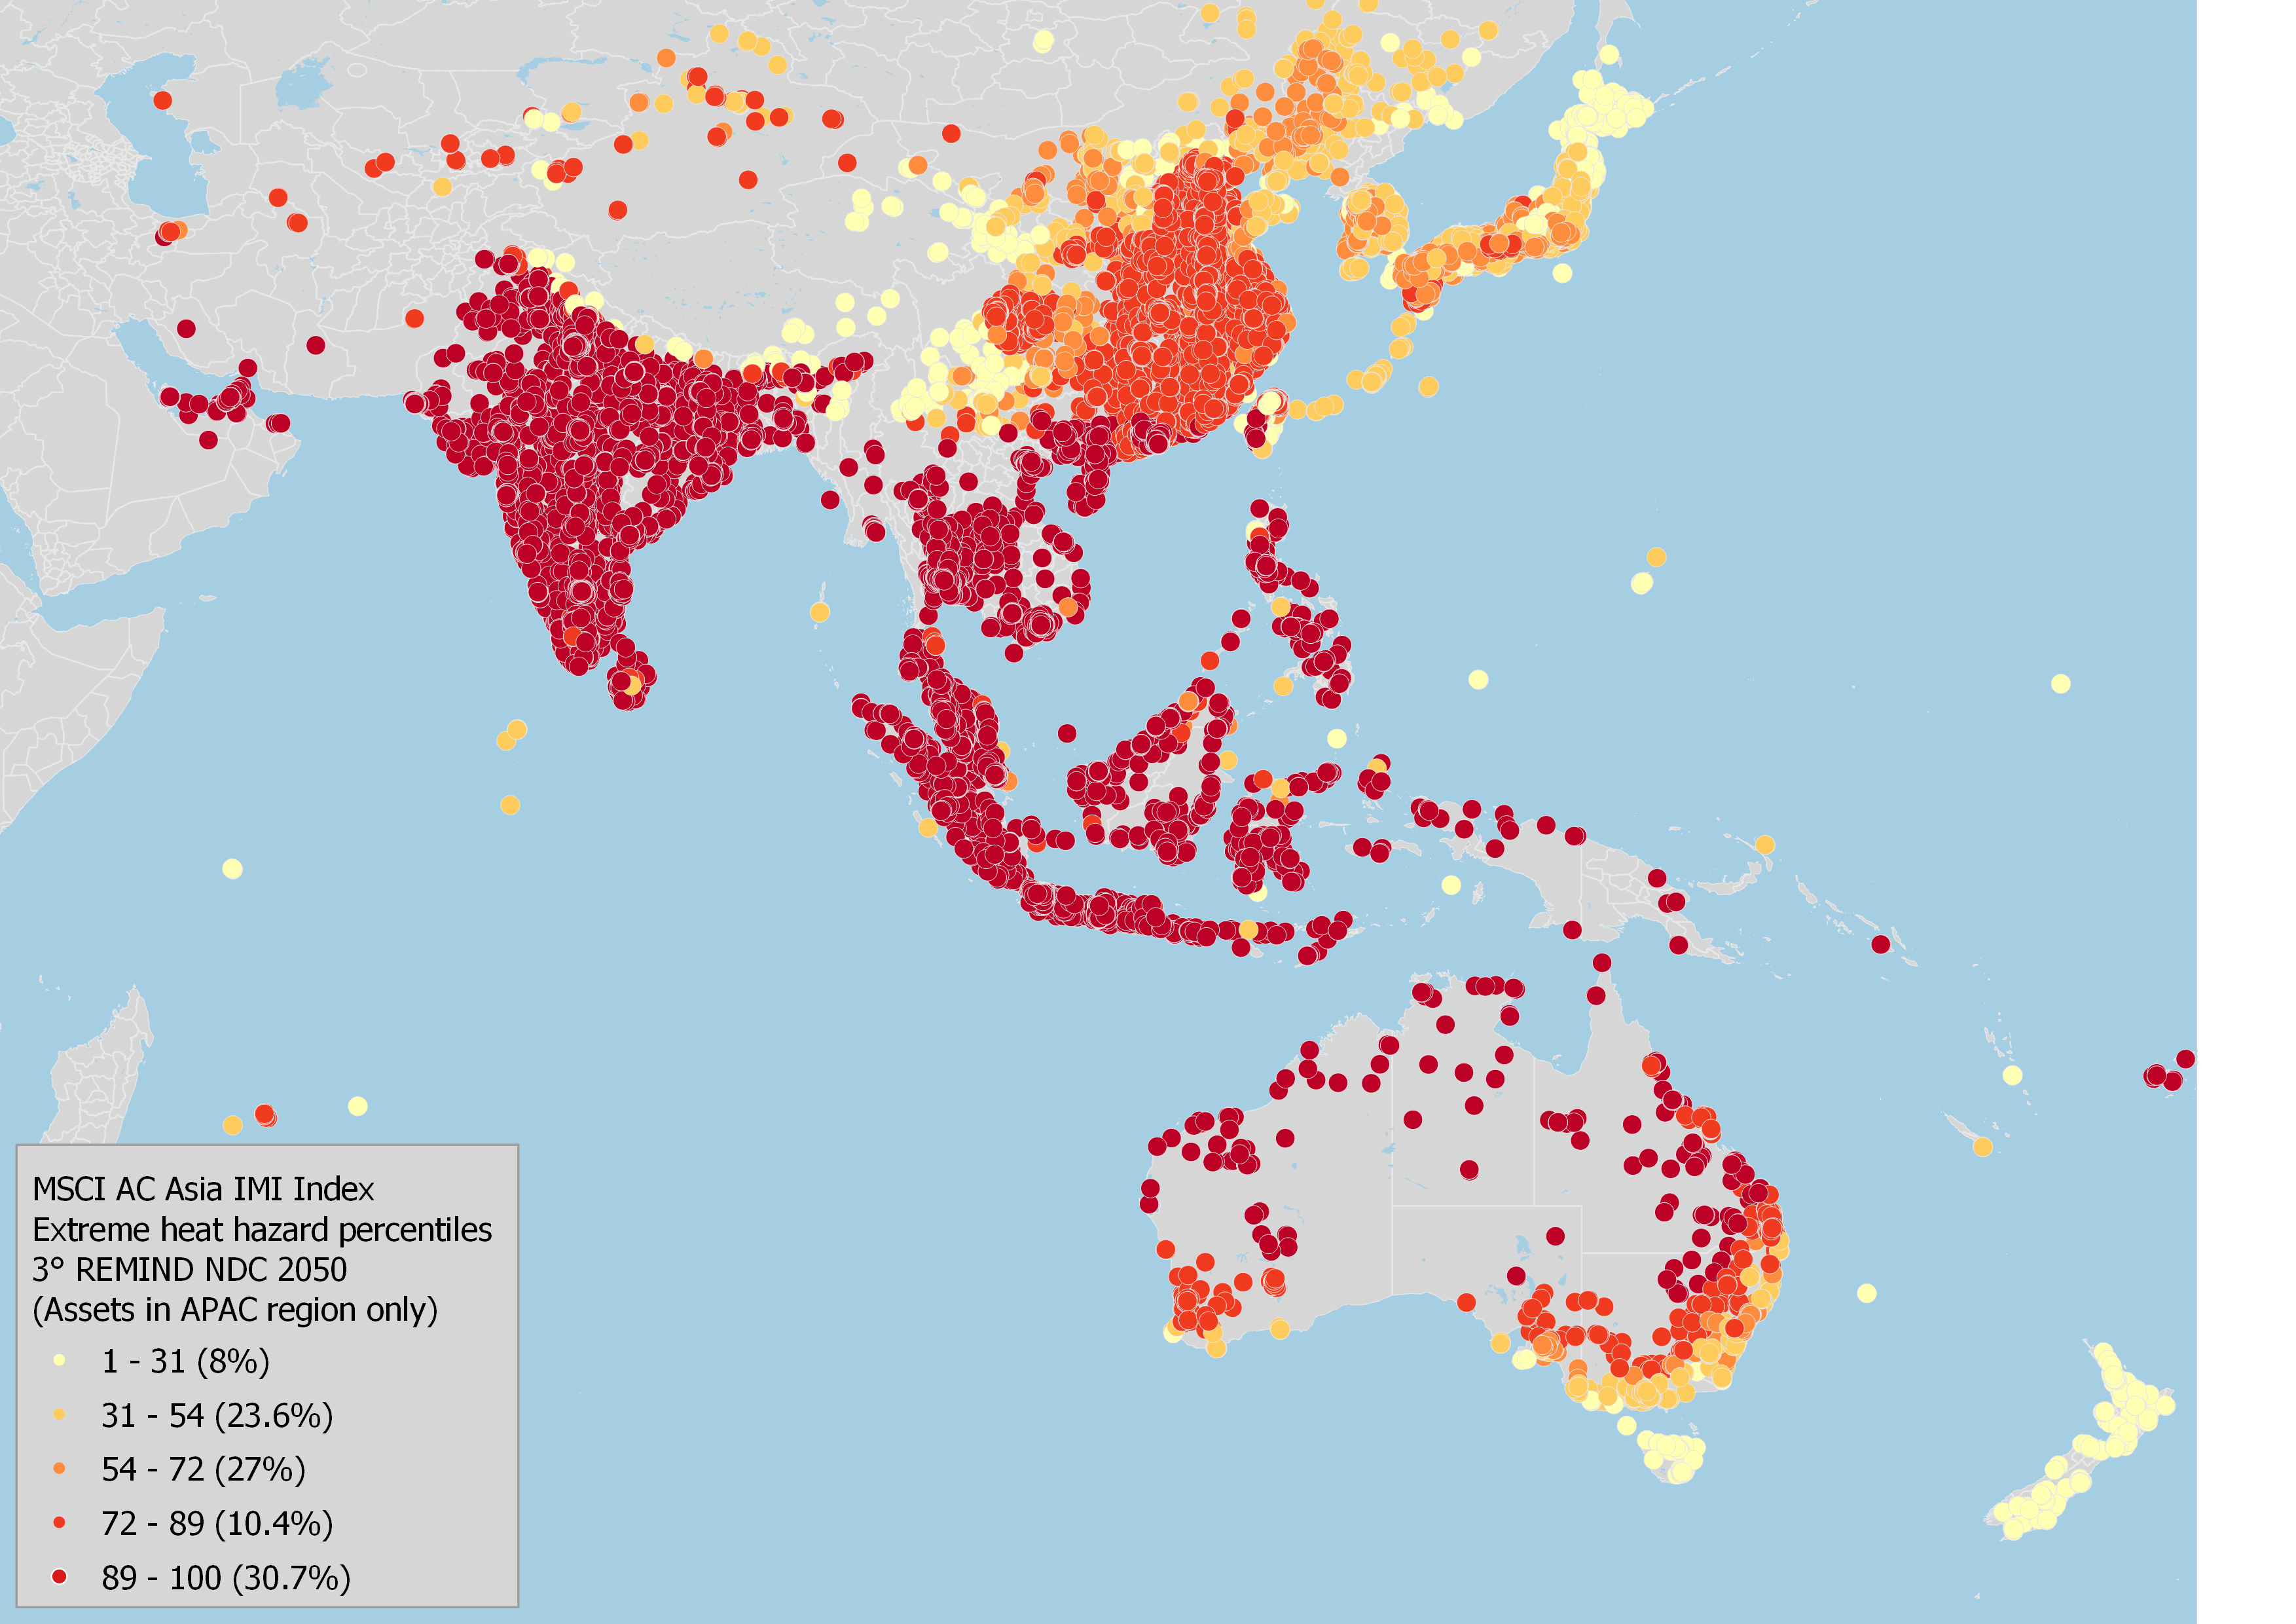
Notes: The maps show the breakdown of assets categorized by hazard percentile scores. An asset’s hazard level is evaluated against the percentiles of the reference data set and assigned a percentile score from 1-100. If an asset is assigned a score of 25, this means that 25% of all assets in the reference data set have a lower hazard level than the assessed asset. Assets with no exposure to the hazard are assigned a score of 0.
To compute hazard percentiles, the hazard data at the location level is evaluated against the physical assets in a global reference data set (the MSCI ACWI Index). Location-level hazard percentiles are computed for current hazard levels and 2050 hazard levels for five different climate scenarios.
Data as of April 2023. Source: MSCI ESG Research

Subscribe todayto have insights delivered to your inbox.
How Extreme Temperatures May Affect Chinese Companies
In the face of rising temperatures in China, comprehensive adaptation and response plans are crucial to mitigate the physical risks of extreme heat, especially for more exposed regions.
On Climate Change, We Got 99 Solutions; Gotta Try Every One
The news on our progress toward climate change and biodiversity goals was not great as Earth Day 2023 approached.
The content of this page is for informational purposes only and is intended for institutional professionals with the analytical resources and tools necessary to interpret any performance information. Nothing herein is intended to recommend any product, tool or service. For all references to laws, rules or regulations, please note that the information is provided “as is” and does not constitute legal advice or any binding interpretation. Any approach to comply with regulatory or policy initiatives should be discussed with your own legal counsel and/or the relevant competent authority, as needed.