Sector-Balanced Futures – One Way to Manage Chinese Equity Exposure
After the Chinese government announced new stimulus measures on Sept. 24, the MSCI China A Index surged 32% to Oct. 8, before retreating nearly 9% through Oct. 18, as investors' views on the effectiveness of the measures has whipsawed.1 Chinese equity options have followed suit with the move to an inverted volatility term structure alongside a sharp rise in implied volatility.2
In the first week of October, implied volatility spiked to 56%, significantly above the five-year average of 28%. Emerging markets (EM) experienced a similar surge, pushing their implied volatility to 24%, largely driven by the Chinese market. Investors are watching this jittery behavior and starting to reassess opportunities and risks in China's equity markets.
A break with the past: rising futures volumes in a rising market
One tool international investors could consider to gain or manage exposure to the A-shares market are futures linked to the MSCI China A 50 Connect Index, which has maintained a 0.96 correlation with the broader MSCI China A Index over the last five years.3 Composed of 50 large and liquid stocks, the MSCI China A 50 Connect Index is a sector-balanced representation of the market.
Daily trading volumes for these futures have surged from Sept. 24 to Oct. 18, 2024, with year-over-year growth surpassing 170%, pushing the year-to-date growth rate in volume to 45%. Previous volume spikes coincided with declining equity markets, such as from August 2023 to January 2024 when the A-share market declined amid high outflows from international investors. The rise over the last several weeks has coincided with rising markets, however, suggesting some investors are taking tactical positions in line with expectations of a bullish scenario linked to the policy interventions.
Term structure has inverted, and volatility risen sharply, in Chinese and EM equities
Loading chart...
Please wait.
Data from Sept. 30, 2019, to Oct. 18, 2024. Implied volatility is based on the average implied volatility of 30-day ATM call and put options. Term structure is calculated using the 91-day to 365-day implied-volatility ratio of ATM options. Options linked to the MSCI Emerging Markets Index and iShares MSCI China ETF were used to calculate the metrics shown for EM and China volatility, respectively. Source: OptionMetrics
Steep uptick in MSCI China A 50 Connect Index futures volume post stimulus
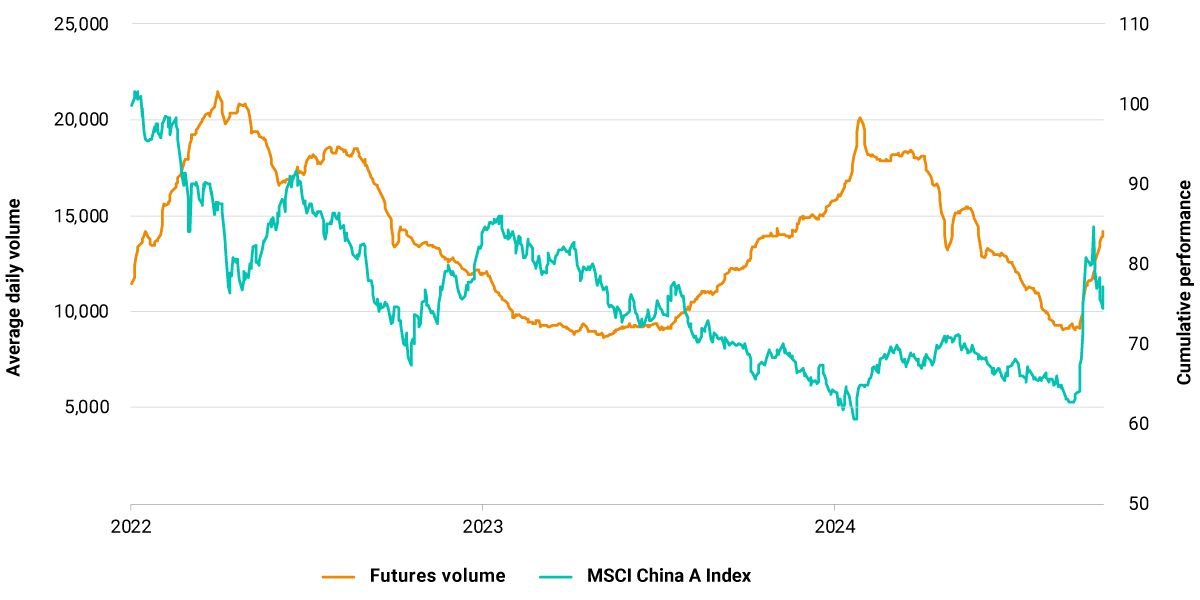
Data from Oct.18, 2021, to Oct.18, 2024. We show the three-month rolling average of daily volume for futures linked to the MSCI China A 50 Connect Index. The futures were launched in October 2021. Source: HKEX


Subscribe todayto have insights delivered to your inbox.
Using Derivatives to Scale China and Emerging Markets ex China
China’s large share of emerging-market (EM) equities and its falling correlations with EM are leading some investors to allocate separately to the two universes. A tactical overlay of futures and swaps could be used to adjust regional exposures.
Evaluating Chinese Equities’ Performance After Stimulus
Global institutional investors in Chinese equities, either using fundamental or quantitative approaches, may find potential opportunities in sector rotation and in factors’ deviations from their long-term patterns.
Foundations of Dedicated China Allocations: Part 4
Although Chinese equities generally performed poorly from 2021 through 2023, certain dedicated China funds earned double-digit annualized returns. We propose a three-layer framework to help demystify the drivers of excess returns in the China market.
1 Returns are reported in gross USD.2 Implied volatility is based on the average implied volatility of 30-day at-the-money (ATM) call and put options. Term structure is calculated using the 91-day to 365-day implied-volatility ratio of ATM options. Options linked to the MSCI Emerging Markets Index and iShares MSCI China ETF were used to calculate the metrics shown for EM and China volatility, respectively.3 Correlation calculated based on monthly returns over the last five years through Q3 2024.
The content of this page is for informational purposes only and is intended for institutional professionals with the analytical resources and tools necessary to interpret any performance information. Nothing herein is intended to recommend any product, tool or service. For all references to laws, rules or regulations, please note that the information is provided “as is” and does not constitute legal advice or any binding interpretation. Any approach to comply with regulatory or policy initiatives should be discussed with your own legal counsel and/or the relevant competent authority, as needed.