Valuations Can Help in Evaluating Sectors
Along with other factors, comparing current sector valuations to longer-term averages has helped investors as they make decisions about whether to rotate in or out of specific sectors.
For example, the first thing to notice on both the price-to-earnings (P/E) and price-to-book (P/B) charts below is how, for many sectors within the MSCI World Index, the most current measurement is above the top quartile of the distribution. In other words, during this period, more than 75% of the measurements would have been lower than the current level.
Digging into the numbers a bit more, we see that, perhaps unsurprisingly, information technology (IT) looks expensive relative to its history. What is more surprising is the magnitude of the gap between current and historical averages, for both P/B and P/E. Over the last few years, IT companies have delivered impressive financial results on the back of increased demand, meaning investors are willing to pay a premium in the expectation that future business growth will follow the same trend.
We saw a similar picture for most sectors, with current P/B and P/E measurements above the median or above the top quartile. The only exceptions were financials, health care and materials, when examined from a P/E perspective.
Regardless of how different investors may interpret these findings, they may be useful to differentiate across sectors.
Valuations measures over time
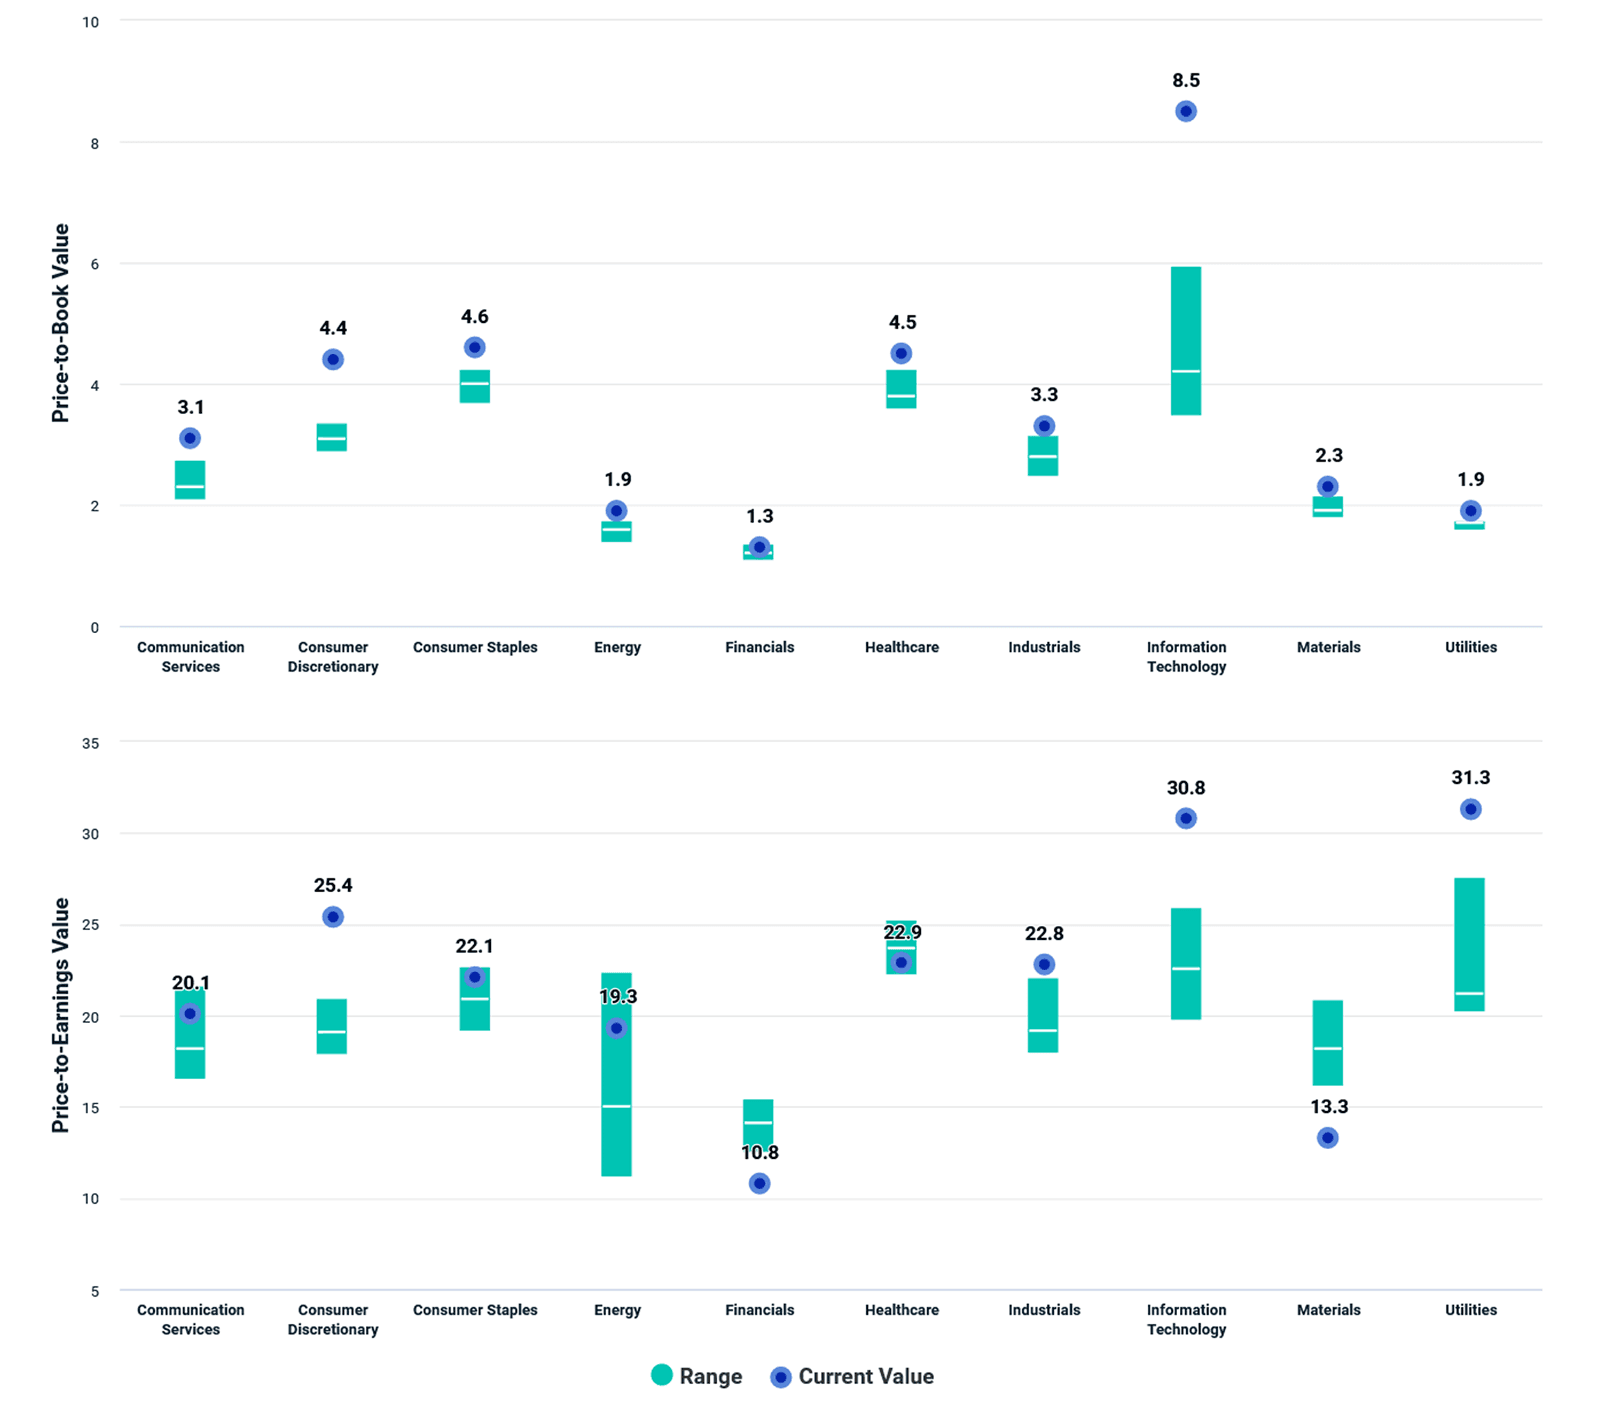
Source: MSCI. Data from March 2012 to February 2022


Subscribe todayto have insights delivered to your inbox.
Global Investing Trends
You’ll find insights provided in research papers, blogs and a Chart of the Week that succinctly puts topical issues in context.
Changing Sectors, Changing Correlations
When considering new sector exposures in their portfolios, investors can review correlations between existing and potential allocations to better understand whether these sectors’ returns moved in the same direction or if exhibited a differentiated return pattern.
Sector Momentum
Our research has shown that an industry momentum approach, which involves investing in industries with the best recent performance, outperformed broad-market equity indexes in developed-market regions from 2000 to 2021.
The content of this page is for informational purposes only and is intended for institutional professionals with the analytical resources and tools necessary to interpret any performance information. Nothing herein is intended to recommend any product, tool or service. For all references to laws, rules or regulations, please note that the information is provided “as is” and does not constitute legal advice or any binding interpretation. Any approach to comply with regulatory or policy initiatives should be discussed with your own legal counsel and/or the relevant competent authority, as needed.