What Connects Correlation and Tax-Loss Harvesting?
Tax-loss harvesting, selling capital assets at a loss to reduce a year-end tax liability, is a well-established practice in the U.S. Realized capital losses generated by selling some or all of a losing position can be used to offset realized capital gains from the sale of a winning position. Some investors, however, have misconceptions about the practice.
The portfolio manager makes the choice of how to reinvest the sale proceeds. The most straightforward example is immediate reinvestment in a similar asset. The portfolio's market value would be unchanged because the amount of capital invested remains the same. Thus, loss harvesting would not change the market value of the portfolio but could capture a capital loss that can be used to lower the investor's tax liability.
Replacing securities by leveraging correlation
How might the manager identify a similar asset, one statistically likely to share the same price behavior as the security that was sold? To illustrate, let's compare stock A with each of two potential replacements. Stock A's estimated future correlation with replacement 1 is 0.74 and with replacement 2 is -0.12.1
The exhibit illustrates the price movement of the three hypothetical stocks over a six-month horizon beginning on Jan. 24, 2023, when the manager purchased stock A (blue line). Suppose the manager decides to harvest the losses from stock A (while avoiding a wash sale2) at the beginning of May after its price declines.
Although the price of replacement 2 (red line) did not fall along with stock A's price in early May, by the end of the period, it had underperformed stock A, consistent with a negative correlation. Replacement 1 (green line), whose price fell more than stock A's in early May, outperformed stock A. The higher estimated future correlation of stock A and replacement 1, versus replacement 2, statistically captured similar price dynamics.3
An important element in tax-loss harvesting is the careful selection of the replacement security, with the goal of preserving the portfolio's value at the point of sale as well as over the long term.
Reaping the full benefit of tax-loss harvesting means carefully selecting the replacement security
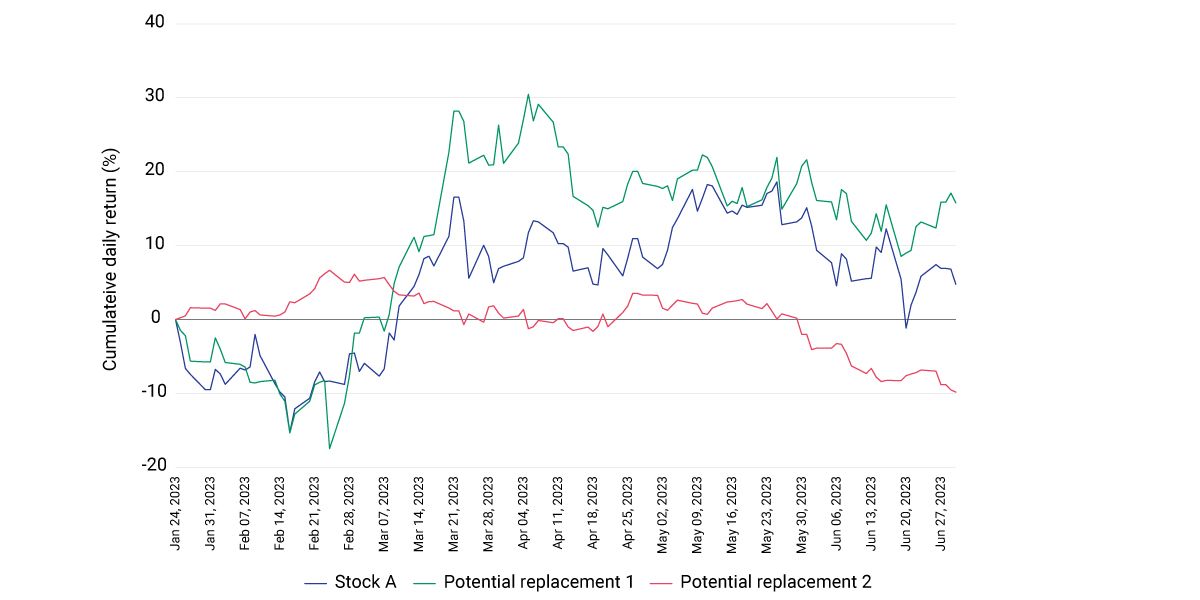
Comparison of three hypothetical stocks’ price movements over a six-month horizon from Jan. 24, 2023, to June 30, 2023. Stock prices are rebased to 100 on the purchase date of stock A. The three stocks have the same country exposure and similar factor exposures. Their industry exposures are of the same magnitude, but replacement 1 is in the same industry as stock A, while replacement 2 is not. Data is based on future estimated correlations from MSCI’s Global Equity Factor Model, or EFGEMLT.


Subscribe todayto have insights delivered to your inbox.
Quantitative Investment Solutions
MSCI Quantitative Investment Solutions (QIS) offers a hosted, scalable, and easy-to-integrate optimization toolkit to help portfolio managers customize separately managed accounts (SMAs) efficiently and at scale in line with each of their clients’ financial objectives.
Wealth Managers
High-net-worth individuals have faster access to financial data and news today. Armed with that information, they are becoming more sophisticated investors, seeking deeper analyses using state-of-the-art tools.
Personalizing Climate-Focused Wealth Management Portfolios
The growing focus by investors on climate change is leading wealth managers to personalize portfolios in ways that off-the-shelf model portfolios may not address.
1 Future estimated correlation is provided by MSCI’s Global Equity Factor Model for Long-Term Investors, or EFGEMLT.2 The wash-sale rule states that if an investment is sold at a loss and repurchased within 30 days, the initial loss cannot be claimed for tax purposes.3 Illustration only, not indicative of actual results. This analysis includes hypothetical, backtested or simulated performance results. There are frequently material differences between backtested or simulated performance results and actual results subsequently achieved by any investment strategy.
The content of this page is for informational purposes only and is intended for institutional professionals with the analytical resources and tools necessary to interpret any performance information. Nothing herein is intended to recommend any product, tool or service. For all references to laws, rules or regulations, please note that the information is provided “as is” and does not constitute legal advice or any binding interpretation. Any approach to comply with regulatory or policy initiatives should be discussed with your own legal counsel and/or the relevant competent authority, as needed.