Are Factors a Thing of the Past?
Video
April 11, 2022
Actually, our data shows Factors matter now as much as ever
This is the first of our 'Fact(or) Fiction?' series, which aims to debunk some common myths around Factor investing, to help you make better investment decisions. In today's volatile markets and uncertain macro environment, going beyond the headlines and taking a deeper look at the drivers of investment outcomes is critical to making informed decisions.
What the data shows
If we look through a Factor lens at the Q1 2022 market rotation from Growth to Value, the data tells an interesting story. Over the long term, the Value style had outperformed Growth investing in the US market, per the chart below. The same trend was observed across other global equity markets. Around 2017 however, Growth began to rally and ultimately surpassed Value during 2019.
MSCI USA V/G historical performance
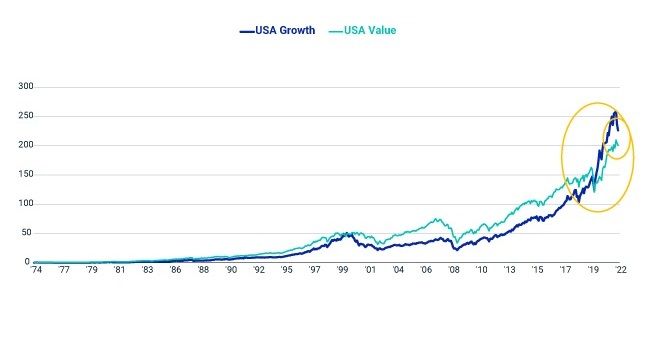
Data as of February 28, 2022 USA Growth outperformed USA Value in 2020-2021 at the fastest historical pace, resulting in relative valuation of Growth to Value reaching its highest point since 2000. However, in early 2022 we saw Value stocks come back into favour. This prompted a well-documented rotation out of Growth and into Value.
A deeper look
This view of a Growth to Value rotation was not wrong but looking deeper provides a more complete picture including indicators that precipitated the rotation. Dimensions of Value - Earnings Yield (EY), Long-Term Reversal (LTR) and Book-to-Price - all had a positive first quarter. In fact, EY and LTR have been the best performing factors in the year to date (YTD¹). As shown in the chart below, Growth has modestly declined, and the riskier Growth stocks suffered larger drawdowns. Why? The Residual Volatility factor, which measures the level of security-specific (or idiosyncratic in technical parlance) risk, has been the weakest performance YTD¹.
Pure Factor performance
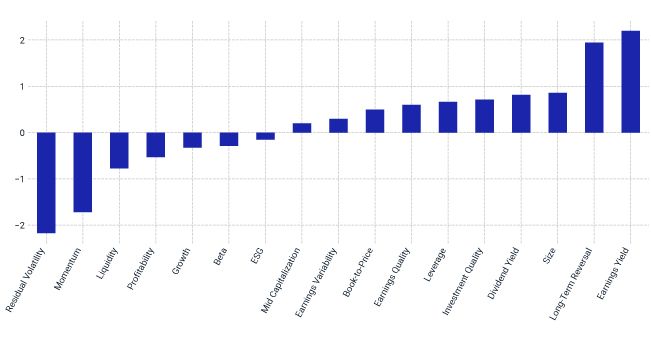
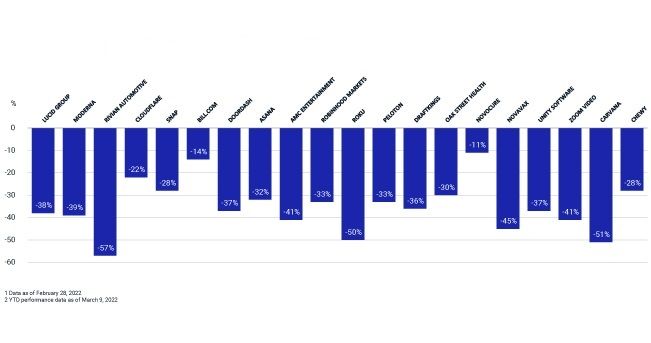
1. Data as of February 28, 2022 As shown in the chart below, the constituents of the MSCI USA Growth Index with the highest exposure to the Residual Volatility factor sharply declined through the end of February, indicating that the riskiest growth stocks suffered the larger drawdowns, on average.
Top 20 MSCI USA Growth stocks with highest residual volatility exposure return
Going beyond the headlines and looking deeper allows investors to better understand the characteristics driving portfolio risk and return. The Factor lens demonstrates the drivers of performance and provides more insight to the simplistic narrative of Growth to Value, highlighting that Residual Volatility caused the downturn in risky growth stocks.
Factor in MSCI
MSCI has published content on Residual Volatility leveraging the MSCI Factor Crowding Model. Crowded factors have historically demonstrated a higher probability of drawdown. In our recent publications, we noted that Residual Volatility was a crowded factor in both the US and Global models, as shown below. The chart on the right shows the historical performance and crowding score for the factor, including the current drawdown period. Notably this same crowding model showed that the earnings yield factor and book-to-price were relatively 'uncrowded factors' at the time observed.
Crowding score of residual volatility
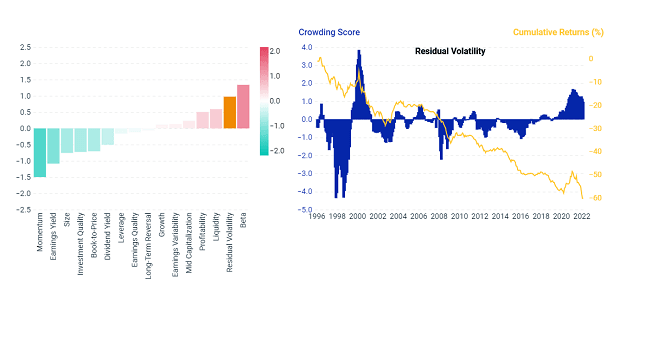
Data as of February 28, 2022 The key takeaway here is that looking at a more complete set of exposures may enable investors to better manage risk and position portfolios for opportunity.
Contact us to learn more about our Crowding Solutions and wider Factor lens.
Subscribe todayto have insights delivered to your inbox.
Factors in Focus: Disentangling Market Gyrations Through the War
Rotation from high-risk momentum growth stocks to value stocks and a roundup of factor performance over the first quarter of 2022.
Which Factors May Be Crowded?
What are the latest factor-crowding scores? How have they changed over time? And how have the different factors performed?
Factors in Focus: Are Your Equity Styles Ahead of the Curve?
(Residual) volatility in a crowded place since late 2020.
The content of this page is for informational purposes only and is intended for institutional professionals with the analytical resources and tools necessary to interpret any performance information. Nothing herein is intended to recommend any product, tool or service. For all references to laws, rules or regulations, please note that the information is provided “as is” and does not constitute legal advice or any binding interpretation. Any approach to comply with regulatory or policy initiatives should be discussed with your own legal counsel and/or the relevant competent authority, as needed.