ASEAN: An Overlooked Emerging Markets Story
Blog post
March 8, 2017
When institutional investors think about Asia's emerging markets, they may tend to pay more attention to the larger and more industrialized economies such as China, Korea and Taiwan. Proportionally less attention is likely paid to the smaller Southeast Asian nations such as Singapore, Indonesia and Malaysia. Yet these countries, which together with Thailand and the Philippines constitute the MSCI AC ASEAN Index, have returned 5.6% a year (gross) over the 10-year period ending Dec. 31, 2016.
Examining returns by dividend yield, dividend growth (which essentially reflects fundamental growth in cash flows) and changes in valuation illustrates the case. Our research suggests that the first two components historically were the two most important contributors to global equity performance in both emerging and developed markets over the long term (below chart). While valuation changes tended to dominate market performance over the short term, dividend yield and growth in cash flows were critical return drivers over the longer term.
Contributors to equity returns in EM Asia regions
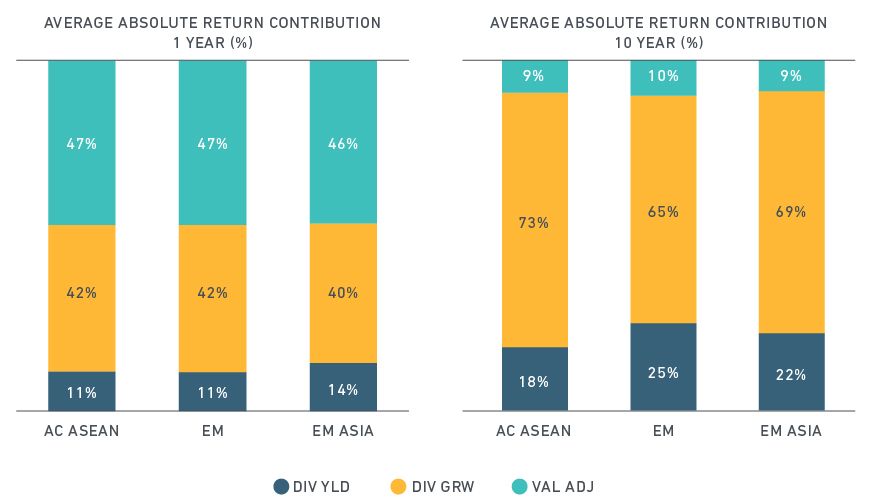
A comparison of the ASEAN Index with broader emerging markets indexes generally highlights the fundamental growth of the former. Dividend yield and dividend growth together accounted for 91% of total returns in ASEAN over the 10-year period ending Dec. 31. In particular, dividend growth for the ASEAN Index exceeded that of the MSCI Emerging Markets Asia Index (which includes China, Taiwan and Korea) as well as the broader MSCI Emerging Markets Index. These growth characteristics reflect ASEAN countries, which together comprise the third-largest population globally. More than half of the population is under 30. Meanwhile, nearly half the population lives in urban areas,1 compared to Japan and the U.S., where 93.5% and 82.4%, respectively, live in urban areas. A lower percentage suggests there is greater potential for growth. With the exception of companies in Singapore, those in ASEAN countries derived more than three-quarters (77%) of their revenues domestically, according to MSCI's economic exposure data. Trade within the bloc accounted for 11% of international economic exposures, as of Oct. 31, 2016. In contrast, companies from more industrialized Asian economies such as Korea and Taiwan derived less than half their revenue domestically. The domestic nature of ASEAN companies' economic exposure may insulate those firms from an increase in protectionist sentiment worldwide.
Economic exposures of global countries (source of revenue)
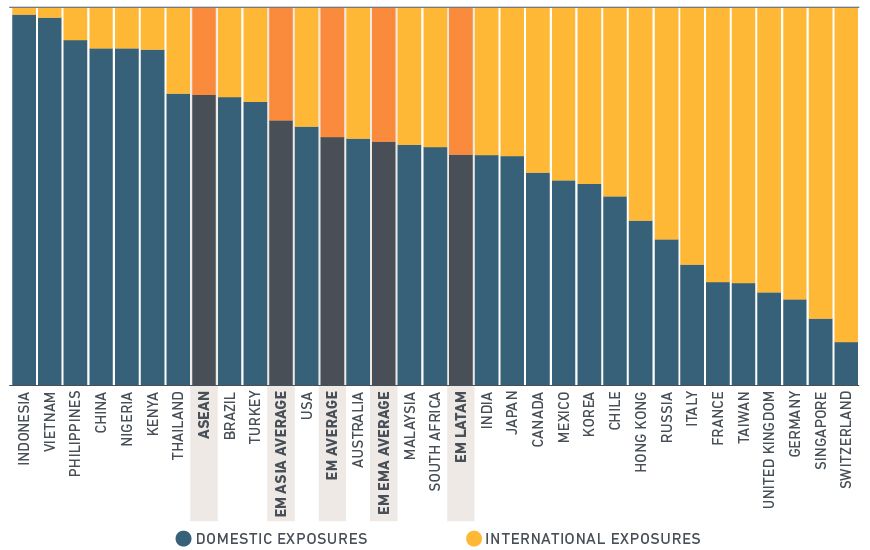
Data as of Oct. 31, 2016
Further reading

Subscribe todayto have insights delivered to your inbox.
The content of this page is for informational purposes only and is intended for institutional professionals with the analytical resources and tools necessary to interpret any performance information. Nothing herein is intended to recommend any product, tool or service. For all references to laws, rules or regulations, please note that the information is provided “as is” and does not constitute legal advice or any binding interpretation. Any approach to comply with regulatory or policy initiatives should be discussed with your own legal counsel and/or the relevant competent authority, as needed.