Five Takeaways for Country Investing from 2025’s Historic Equity Shift
Key findings
- The outperformance of non-U.S. stocks year to date — surpassing U.S. stocks by 10% in USD and creating one of the widest gaps in the last 50 years — has been a wake-up call for asset allocators.
- Home bias remains an active bet against global diversification. ETF holdings show investors are still overweight in local markets. For example, U.S.-listed stock ETFs held 80% in U.S. stocks as of the end of February.
- Our regional beta measure indicates countries were aligning in a tripolar world even before April’s tariff surprise. Fundamentals highlight the distinct diversification benefits by country.
A rare double-digit performance gap favoring non-U.S. equities over their U.S. counterparts opened up in early 2025, accompanied by a shift in fund flows away from the U.S. and into Europe, Asia and emerging markets (EM).[1] At the same time, the U.S.'s net international investment position, historically propelled by strong foreign appetite for U.S. stocks and bonds, may be showing signs of reversing,[2] potentially prolonging the weakness in the USD and other U.S. assets. And while U.S. equities are still a sizable 63% share of the global universe, a shift in market leadership may be underway, driven by downward revisions in U.S. growth expectations amid tariff concerns.
Five key takeaways have emerged from equity markets' behavior so far this year:
1. Historic performance gap between US and non-US stocks
Non-U.S. stocks outperformed U.S. stocks by 10% year to date through April 25, marking the 7th-largest such gap over the last 50 years. As a result, non-U.S. stocks' weight in the MSCI ACWI Investable Market Index (IMI) sharply reversed the declining path they had followed since the global financial crisis (GFC) in 2008. Having once composed 70% of the global equity universe, non-U.S. stocks' capitalization weight reached an historic low at the end of 2024. Souring fundamentals and the shock to consumer confidence — even after the 90-day tariff pause — point to continued downside risk for U.S. equities.[3]
From historic lows to Q1 rebound: Non-US equities snap back in 2025
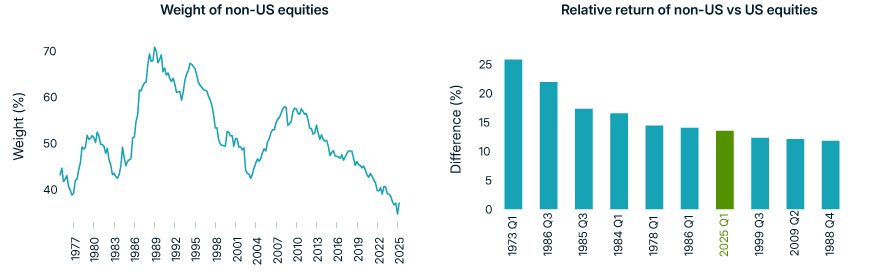
Data from Dec. 31, 1974, to April 25, 2025. Left: Weights of non-U.S. stocks in the MSCI World Index through Dec. 31, 1987, MSCI ACWI Index through April 30, 1998, and MSCI ACWI IMI thereafter. Right: The 10 largest gaps in quarterly returns, gross in USD, from Dec. 31, 1994, through April 25, 2025. April 2025 returns are included in Q1 2025.
2. Geographic leadership shift from the US may be in the offing
While the U.S. equity market has meaningfully outperformed its global peers for much of the post-GFC era, historical data suggest these cycles can — and do — shift. Over the last five decades, leadership in the home-bias premium (the relative return of a country over the broad market, excluding that country) has rotated multiple times.
Japan's meteoric rise in the 1970s and1980s (when the U.S. faced stagflation) gave way to Europe's strength in the 1990s to late 2000s, followed by the resource-driven surge in Australia and Canada throughout the 2000s to early 2010s. More recently, the U.S. assumed the lead following the GFC.
Leadership in the home-bias premium has rotated among countries over time
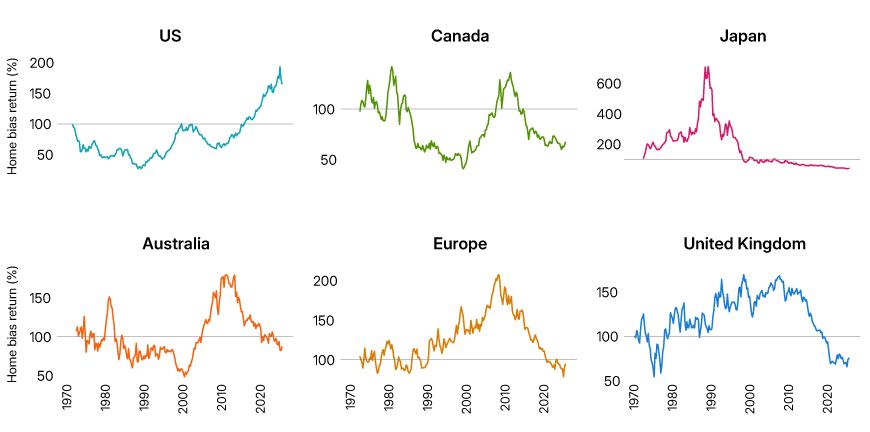
Data from Dec. 31, 1971, through April 25, 2025. We calculated the home-bias premium as the return of the respective MSCI country index's return relative to the return of the MSCI World Index, excluding that country, in the region's home currency. Europe's home-bias returns are in DEM prior to the introduction of the EUR. The Country Indexes report in MSCI's Global Markets Overview has more information on historical home-bias returns.
3. It's not just the US — home bias is global
Our analysis of approximately USD 10 trillion in ETF holdings across several major domiciles found that investors consistently overweight their domestic equity positions relative to a neutral global benchmark.[4] In the U.S., where wealth advisors and individual investors are the primary users of ETFs, there is about a 15% overweight to domestic stocks. Other markets, particularly Japan, India and China, display even stronger home biases. Consistent with our and others' research, home bias is often the single largest tilt in equity portfolios.[5]
Holders of US-listed ETFs were 15% overweight in US equities
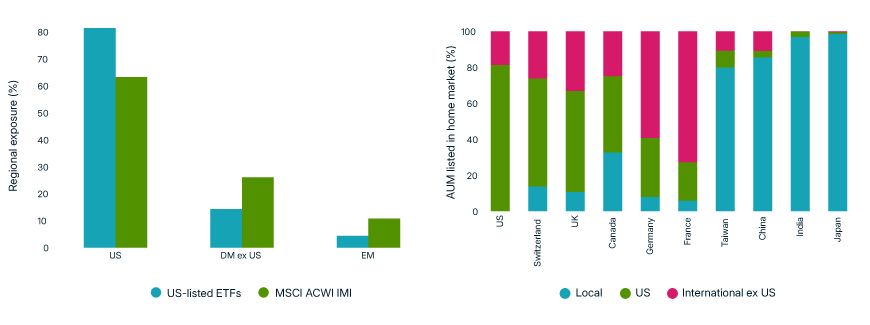
Estimated as of March 31, 2025. The information was generated from third-party sources, and MSCI does not assert the accuracy of the information. Left: Based on all U.S.-listed ETFs tracking more than USD 7.8 trillion in assets. Right: ETF groupings (tracking more than USD 10 trillion) were based on their listing country. Assets under management (AUM) was based on the geographical focus of the funds.
4. US valuations remain elevated despite April's pullback
We compared the major regional equity markets — and mega caps, ex-mega caps and small caps in the U.S. market — on several fundamental metrics: return on equity, dividend yield, earnings multiple (P/E), projected real earnings growth and price to projected growth (PEG).
Across all markets we analyzed, U.S. mega caps were still the most profitable and most expensive segment of the global equity universe, even after April's abrupt market disruption. We found that several European countries boast stronger real earnings growth at comparatively lower valuations (based on PEG ratios) than in the past, and India's elevated multiples appear more mid-range in the context of its stronger growth outlook.
US mega caps were more profitable, though still pricier, than other markets
Loading chart...
Please wait.
Ratios are as of April 25, 2025, and are based on the MSCI Fundamental Data Methodology. Real earnings growth is the long-term forward earnings growth minus the forecasted inflation projection sourced from the International Monetary Fund. Several smaller markets, and those with missing inflation forecasts, were excluded.
5. Continued momentum toward a tripolar world
We applied the MSCI Global Equity Factor Model, anchoring on each market's fundamentals, to gauge how strongly individual markets are tied to the U.S., Europe and EM, and how these relationships have changed over the last 15 years — that is, long before tariff tensions. In the plot below we compare "regional" betas in 2010 with today.
Since 2010, a shift into more-distinct regional camps has occurred, implying that global diversification benefits may be stronger now than on the heels of the GFC, when many individual markets clustered together, although the U.S. stood apart even then.
For example, Canada's trade ties had been drawing it closer to the U.S. as well as to Europe. China has become more distinctly EM than other emerging economies, in part because it represents such a large share of the EM market today. Meanwhile, Japan, Australia and Saudi Arabia still straddle all three regions, reflecting their connections to both developed and emerging markets.
Diversification benefits may be stronger now than after the GFC
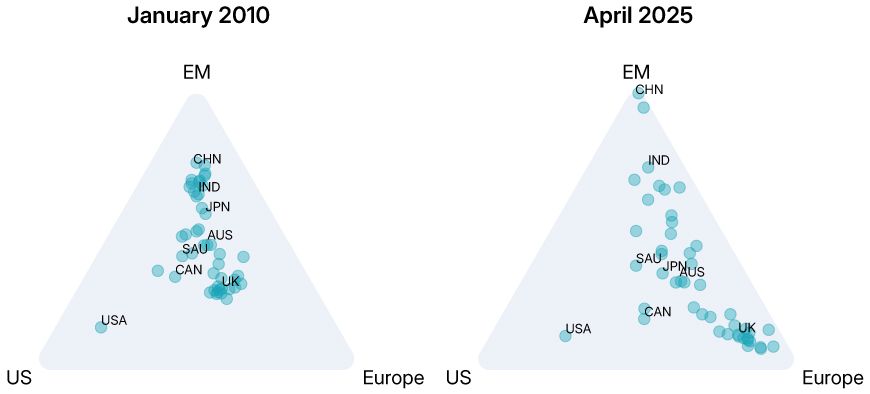
We used the MSCI Global Equity Factor Model to estimate each country's beta to the MSCI USA, Emerging Markets and Europe IMI indexes. Betas are as of Dec. 31, 2009, and April 25, 2025, respectively. The three betas are rescaled to sum to one and show the share of an individual market's overall beta allocated to each of the three regions.
Is now the time to leave home bias behind?
Taken together, the U.S. market's recent struggles, the persistence of home bias among asset allocators and individual investors and the renewed opportunities outside the U.S., could signal avenues for investors looking to reassess geographic exposures.


Subscribe todayto have insights delivered to your inbox.
1 Fernando Luque, “Stock Investors Start to Shift Money from the US to Europe,” Morningstar, March 24, 2025.2 Mike Dolan, “High-water mark for scary US investment deficit?” Reuters, March 27, 2025.3 Neel Kashkari, “Potential Implications of Announced Tariffs for Monetary Policy, Federal Reserve Bank of Minneapolis, April 9, 2025.4 While familiarity, regulatory constraints and tax considerations can sometimes justify a home bias — especially for investors who need to match local currency liabilities — it can also stem from behavioral preferences.5 Jan-Carl Plagge and James Rowley, “No Matter If Active or Index Fund Investors — Investors Are Home Biased,” Journal of Beta Investment Strategies 15, no. 4 (Winter 2024) 8–22.
The content of this page is for informational purposes only and is intended for institutional professionals with the analytical resources and tools necessary to interpret any performance information. Nothing herein is intended to recommend any product, tool or service. For all references to laws, rules or regulations, please note that the information is provided “as is” and does not constitute legal advice or any binding interpretation. Any approach to comply with regulatory or policy initiatives should be discussed with your own legal counsel and/or the relevant competent authority, as needed.