Is momentum a crowded trade that is starting to unwind?
Blog post
August 29, 2018
The momentum factor has been on a tear the last year and a half. Is momentum a crowded trade that has started to unwind?
The MSCI USA Momentum Index returned 37.8% in 2017, compared to 21.9% for the parent MSCI USA Index, and produced 4.1% of active return above the parent through the first six months of 2018. High valuations of momentum stocks combined with unusual factor performance in June, when both momentum and value underperformed (see What's going on with factor returns?), may make one question whether momentum's performance can persist, and if June marked the start of a shift in investor positioning.
Our analysis found that from early June through mid-August the momentum factor showed crowding levels that historically have indicated increased drawdown risk, factor volatility and potentially diminished performance over the subsequent one to two years.
MODEL SHOWS MOMENTUM FACTOR CROWDING
In the exhibit below, we show the MSCI Factor Crowding Model1 crowding scores for the style factors in MSCI's Barra® US Total Market Model as of Aug. 17, 2018. Momentum was the most crowded factor with a combined score of about 1.2. We also see that the valuation spread component was the largest contributor to the score, indicating that high momentum stocks were more overvalued compared to low momentum stocks to a greater extent than they had been in the past. Similarly, the positive value of the short interest spread component indicates that low momentum stocks were more heavily shorted relative to high momentum stocks to a greater extent than they had been in the past.
Momentum factor records high crowding score
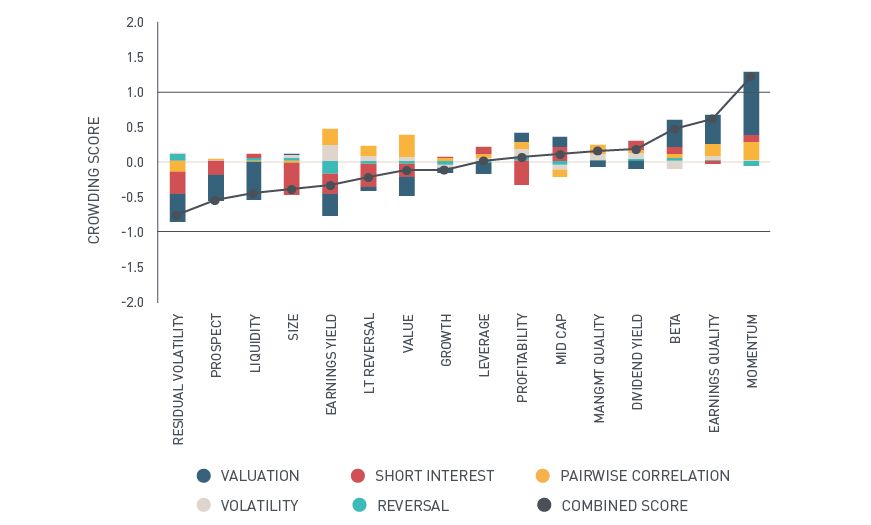
Crowding scores for MSCI's Barra US Total Market Model style factors as of Aug. 17, 2018. The scores are expressed as standardized z-scores and we use a threshold of +/- 1 to mark high levels of crowding or uncrowding. The solid black line is the combined crowding score while the colored bars represent the component contributions.
While crowding scores slightly above one are not extreme – momentum's scores spiked above six during the tech bubble – we have found historically that factors with crowding scores above one have had a much higher frequency of significant drawdowns over the following 12 months than those with lower crowding scores. This trend is illustrated in the exhibit below.
Crowding scores above one have led to higher drawdown frequency
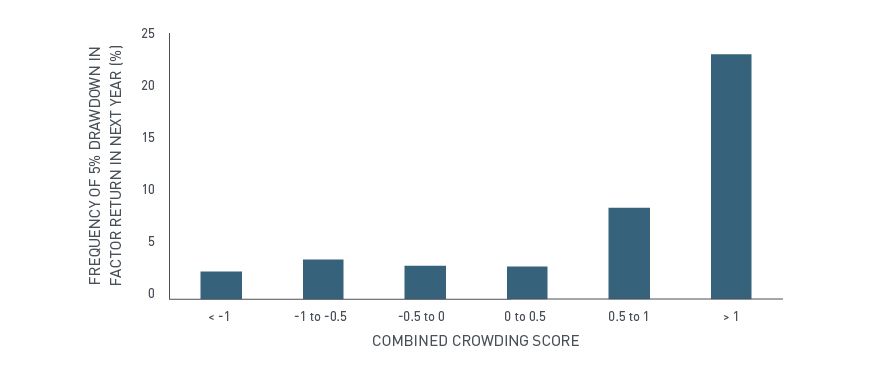
Data from 1996 to 2018
HOW MOMENTUM HAS MOVED OVER TIME
For historical context, we plot the history of the momentum factor's crowding score along with its cumulative factor return. We see below that our model measured high levels of crowding (scores above one) during the late 1990s, the 2007-2008 period and at the end of 2015. Momentum experienced significant drawdowns or elevated volatility after each of these periods.
Momentum's MSCI Crowding Scores and performance over time
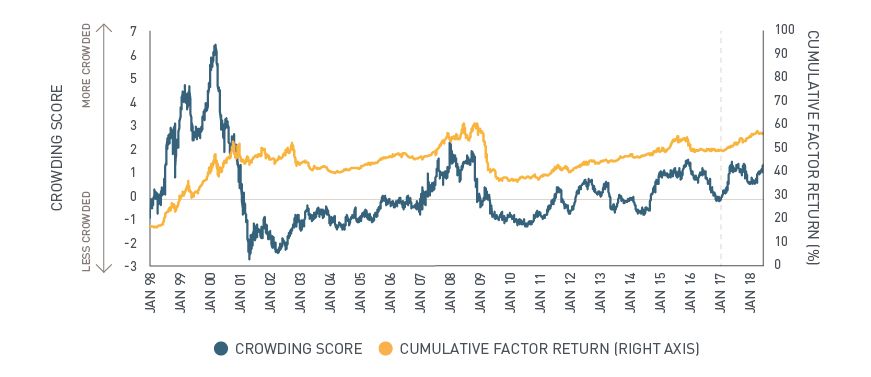
Data from Jan. 1, 1998 to Aug. 17, 2018
Zeroing in on the period of momentum's recent outperformance, our model measured high levels of crowding during the second half of 2017 and, most recently, between June 1 and Aug. 17, 2018. During the latter period, the momentum factor return was slightly negative, compared to a +3.6% return for the January to May period.
Momentum's recent MSCI Crowding Scores and performance
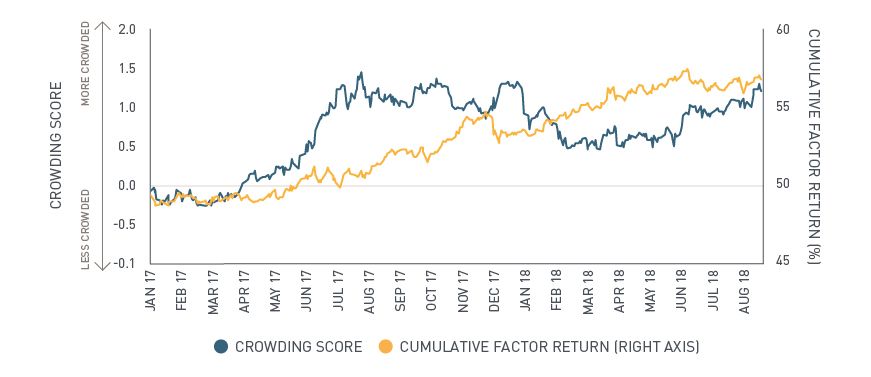
Data from Jan. 1, 2017 to Aug. 17, 2018
While our crowding model scores for momentum are not in bubble territory, they are at a level where we have observed elevated risks of drawdowns and deteriorating performance in the past. Only time will tell if momentum's reign has ended, but investors may wish to take stock of their views and exposures.
1 See Bonne et al. (2018). MSCI Factor Crowding Model, MSCI Model Insight.
Further Reading


Subscribe todayto have insights delivered to your inbox.
The content of this page is for informational purposes only and is intended for institutional professionals with the analytical resources and tools necessary to interpret any performance information. Nothing herein is intended to recommend any product, tool or service. For all references to laws, rules or regulations, please note that the information is provided “as is” and does not constitute legal advice or any binding interpretation. Any approach to comply with regulatory or policy initiatives should be discussed with your own legal counsel and/or the relevant competent authority, as needed.