Sovereign Sustainability: How Duration Impacts Returns in Labeled Sovereign Bonds
Sustainable investing for sovereign bonds may come with a caveat: Green bonds tend to have longer duration profiles than non-labeled equivalents.1
We compiled a sample basket of green bonds that exhibited characteristics of good governance, doing no significant harm and contributing positively to the environment — bonds that passed our "Sustainable Investment (SI) Sovereign Labeled Bonds Screen."2 We compared this basket with the non-labeled bonds from the same 14 sovereigns (left-hand exhibit below).3 While the trend is not aligned across all the countries, the weighted average duration for the sovereign green bonds in the sample was 9.5 years, compared to 7.7 years for the non-labeled sample.4 This duration difference was particularly pronounced in eurozone countries such as France, Germany, Italy, the Netherlands and Spain. This suggests that investors with a specific duration strategy may need to be careful selecting which SI sovereign bonds to buy.
This longer duration impacted returns over the past year. When analyzing the sample, the weighted average returns for most of the SI sovereign green bonds were lower than those for equivalent non-labeled bonds between June 2023 and June 2024, with this trend being particularly pronounced for eurozone countries, as shown in the exhibit on the right below.
The sample of EUR-denominated non-labeled bonds outperformed largely due to term structure. The EUR rate curve over the last 12 months has been inverted, with short-term yields falling more than long-term yields.5 As a result, the longer-duration group benefited less from the decline in short-term rates. The last 12 months were generally poor for sovereign bonds with higher duration; the average return for bonds in the shorter-duration groups was higher than the longer-duration groups.6 Green bonds issued by Denmark, the one exception to lower SI returns, benefited from this because its green bonds had marginally lower duration than its non-labeled counterparts. Like the EUR curve, DKK rates also fell more in the front end, resulting in stronger price appreciation for the shorter-duration Denmark SI bond sample.
The duration narrative may become more balanced if sovereigns issue more green bonds throughout their yield curves. It makes sense that green bonds are oriented toward a longer time horizon, however: They potentially signal to the market that a government is committed to sustainable development. Investors may want to bear in mind that there tend to be differences in duration profiles for investing in sustainable sovereign bonds.
Modified duration, weighted by USD-equivalent outstanding by bond type and by sovereign
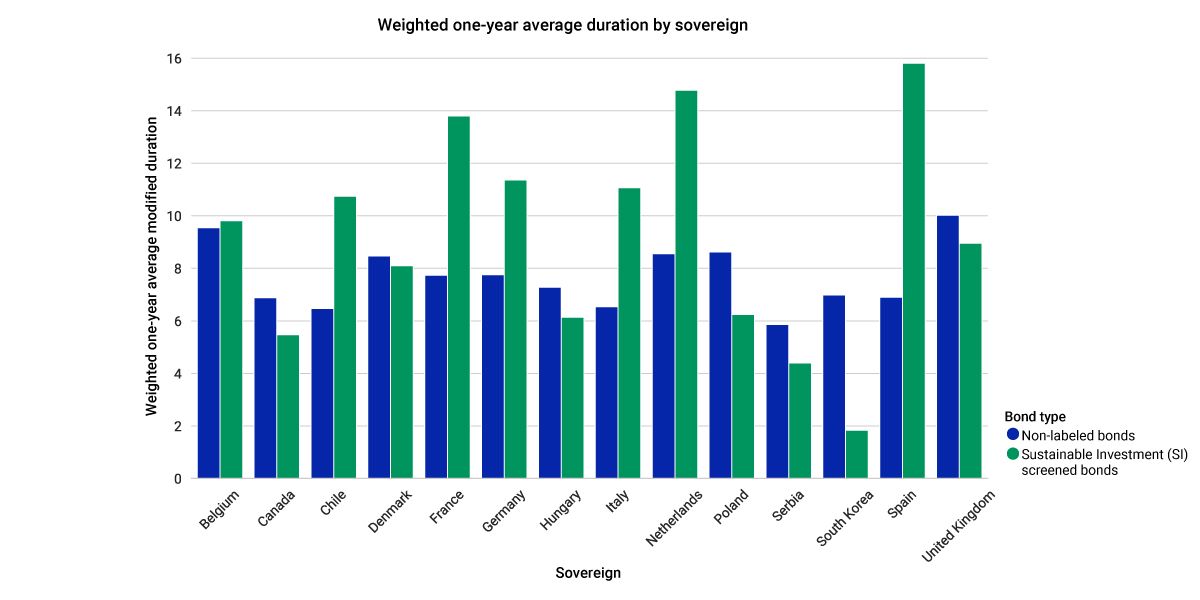
Data as of June 11, 2024. The bonds in this sample were chosen first based on if the sovereign had green bonds outstanding which passed our “Sustainable Investment (SI) Sovereign Labeled Bonds Screen” and had been outstanding for over one year. We then cross-checked the sovereign issuers with the J.P. Morgan Government Bond Index (GBI) and the J.P. Morgan Emerging Market Bond Index (EMBI). We included all non-labeled bonds from these indexes in the sample. Finally, we excluded the SI bonds for sovereign issuers which were not included in either of these two indexes. Duration is based on the weighted one-year average by sovereign and by bond type. The groups are weighted by bond-amount outstanding. Data is for the time period of June 11, 2023, through June 11, 2024. N = 447 non-labeled bonds and 39 bonds that passed our SI screen. Source: MSCI’s BarraOne®, MSCI ESG Research
Total returns, weighted by USD-equivalent outstanding by bond type and by sovereign
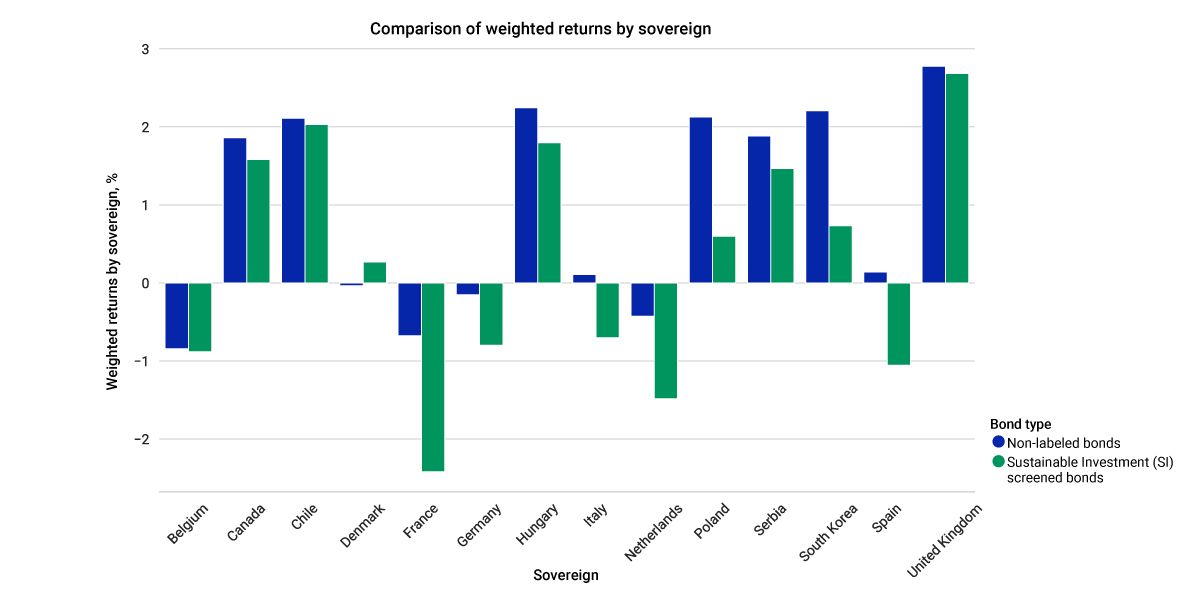
Data as of June 11, 2024. Returns are year-on-year, measured for the time period of June 11, 2023, through June 11, 2024. N = 447 non-labeled bonds and 39 SI-compliant bonds. Source: MSCI’s BarraOne, MSCI ESG Research


Subscribe todayto have insights delivered to your inbox.
Sovereign Bonds and Climate
Good emissions data is essential for any detailed sovereign-bond climate analysis. In this paper, we address some key questions around how best to quantify sovereign bonds’ financed emissions and climate-transition risk.
A Silver Lining for Climate-Tilted Bond Portfolios?
Some sovereign-bond investors seeking to support climate mitigation might be interested in the idea of increasing their exposure to issuers with lower carbon emissions. Would this have been a good approach?
Measuring Sovereign Bonds’ Climate Risks and Opportunities
Quantifying sovereign bonds’ physical and transition risks may help investors determine the climate resiliency of their portfolios. MSCI Climate Change and Natural Hazards Risk Factor Score may help guide the analysis of these complex risks.
1 Outside of this analysis, other authors have also identified the longer duration profiles of labeled bonds, such as Afsaneh Mastouri et al. in “How Sovereigns Have Changed the Green-Bond Market,” MSCI Research, April 19, 2023; and Luca Manera in “Mind the (duration) gap: from risk to opportunity in green bonds,” Asteria Investment Managers, Nov. 30, 2023. 2 More details available in “MSCI SFDR Article 2(17) Sustainable Investment Methodology for Sovereign Labelled Bonds,” MSCI ESG Research, July 12, 2024. (Client access only).3 As of July 3, 2024, around 24 countries have green bonds that pass our SI screen. We selected a more limited sample of 14. The bonds in the overall sample were chosen first based on whether the sovereign had green bonds outstanding that passed our SI screen and had been outstanding for over one year. We then cross-checked the sovereign issuers with the J.P. Morgan Government Bond Index and the J.P. Morgan Emerging Market Bond Index. We included all non-labeled bonds from these indexes in the sample. Finally, we excluded the SI bonds for sovereign issuers that were not included in either of these two indexes.4 The weighted average duration for the Bloomberg/MSCI Green Bond Index was also about one year longer from June 2023 to June 2024 versus the Bloomberg Global Aggregate Index, suggesting that this theme is not unique to sovereign green bonds. Source: MSCI’s BarraOne®.5 The EUR-denominated rates fell between 40 and 50 basis points (bps) between the one- and six-year tenors. However, this decline became less pronounced further out in the curve, with the 20-year part of the curve only falling 9 bps and the 30-year rates increasing by 3 bps. Source: MSCI BarraOne, European Central Bank.6 For example, the average return for the duration bucket of 0 to 2 years was around 1.0% and -0.5% for the 15+ year bucket. The average return declined for each bucket as duration increased. Source: MSCI BarraOne.
The content of this page is for informational purposes only and is intended for institutional professionals with the analytical resources and tools necessary to interpret any performance information. Nothing herein is intended to recommend any product, tool or service. For all references to laws, rules or regulations, please note that the information is provided “as is” and does not constitute legal advice or any binding interpretation. Any approach to comply with regulatory or policy initiatives should be discussed with your own legal counsel and/or the relevant competent authority, as needed.