US Default Could Leave Investors Nowhere to Hide
The market-implied probability of a U.S.-government default stood at 3.5% on May 23, as investors still viewed the possibility of such a default as a tail event.1 But the consequences of a default could be severe and long-lasting. We explore three default scenarios, with losses for a diversified portfolio of global equities and U.S. bonds and real estate ranging between 9% and 18%.
Bad for equities, but what about bonds?
Our first scenario assumes a short-lived technical default, where payments are delayed but ultimately paid. Significant economic damage is avoided, but a general aversion to risky assets drives equity prices 15% lower and credit spreads 60 basis points (bps) wider. Treasurys suffer from a "stigma effect" resulting from both the newly established precedent that the U.S. can default and investor concern that future debt crises could become more frequent. Yields on 10-year Treasurys rise 40 bps.2
Our second scenario also assumes a short-lived technical default, but the negative impact on the economy is greater. Slower growth makes Treasurys more attractive, partly because of a greater decline in inflation and because of expectations of looser monetary policy. The result is a rally in Treasurys, but wider corporate-bond spreads and lower equity prices. Despite being at the center of the turmoil, Treasurys dampen portfolio losses.
Our third scenario assumes a protracted default with significant economic damage.3 U.S. equities fall by 30% and corporate spreads widen by 160 bps. Many Treasury securities miss payments for an extended period of time. Ultimately payments are made but investor confidence is shaken. Ten-year Treasury yields rise 80 bps, and the dollar weakens 15% versus the euro as investors search for opportunities outside of the U.S.4
Scenario impact across asset classes
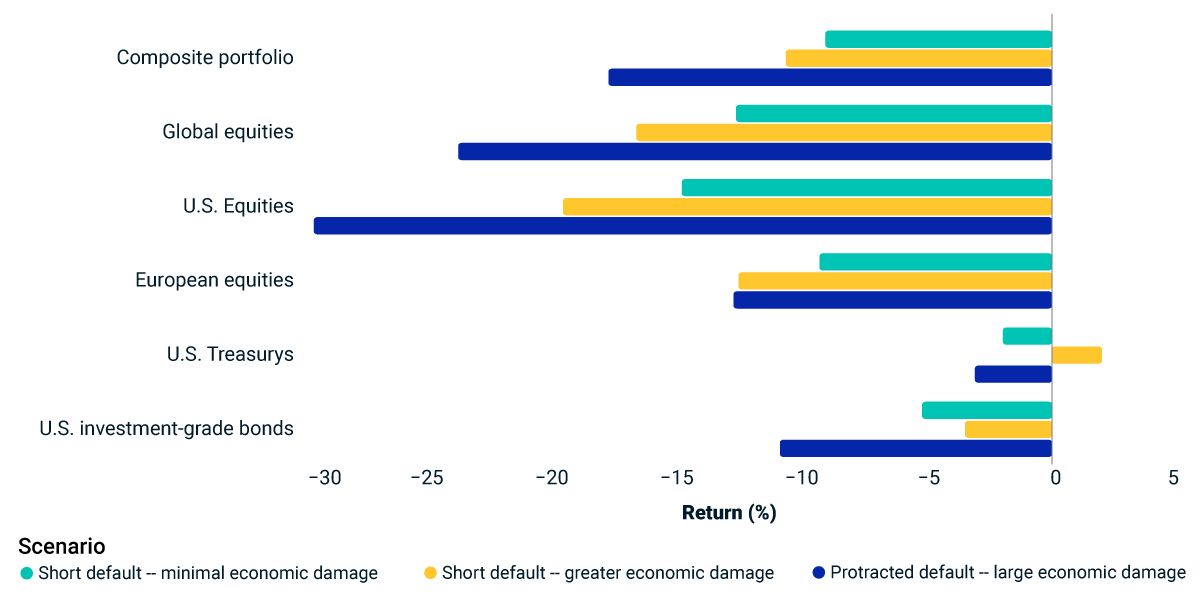
Portfolio impact of the scenarios based on market data as of May 16, 2023. Treasury inflation-protected securities are represented by the iBoxx TIPS Inflation-Linked Index provided by S&P Dow Jones Indices. U.S. Treasurys, equities and corporate bonds are represented by MSCI indexes. U.S. real estate is represented by the MSCI/PREA U.S. AFOE Quarterly Property Fund Index. The composite portfolio is 50% global equities, 10% Treasurys, 10% Treasury inflation-protected securities, 10% U.S. investment-grade bonds, 10% U.S. high-yield bonds and 10% U.S. real estate.
Scenario assumptions
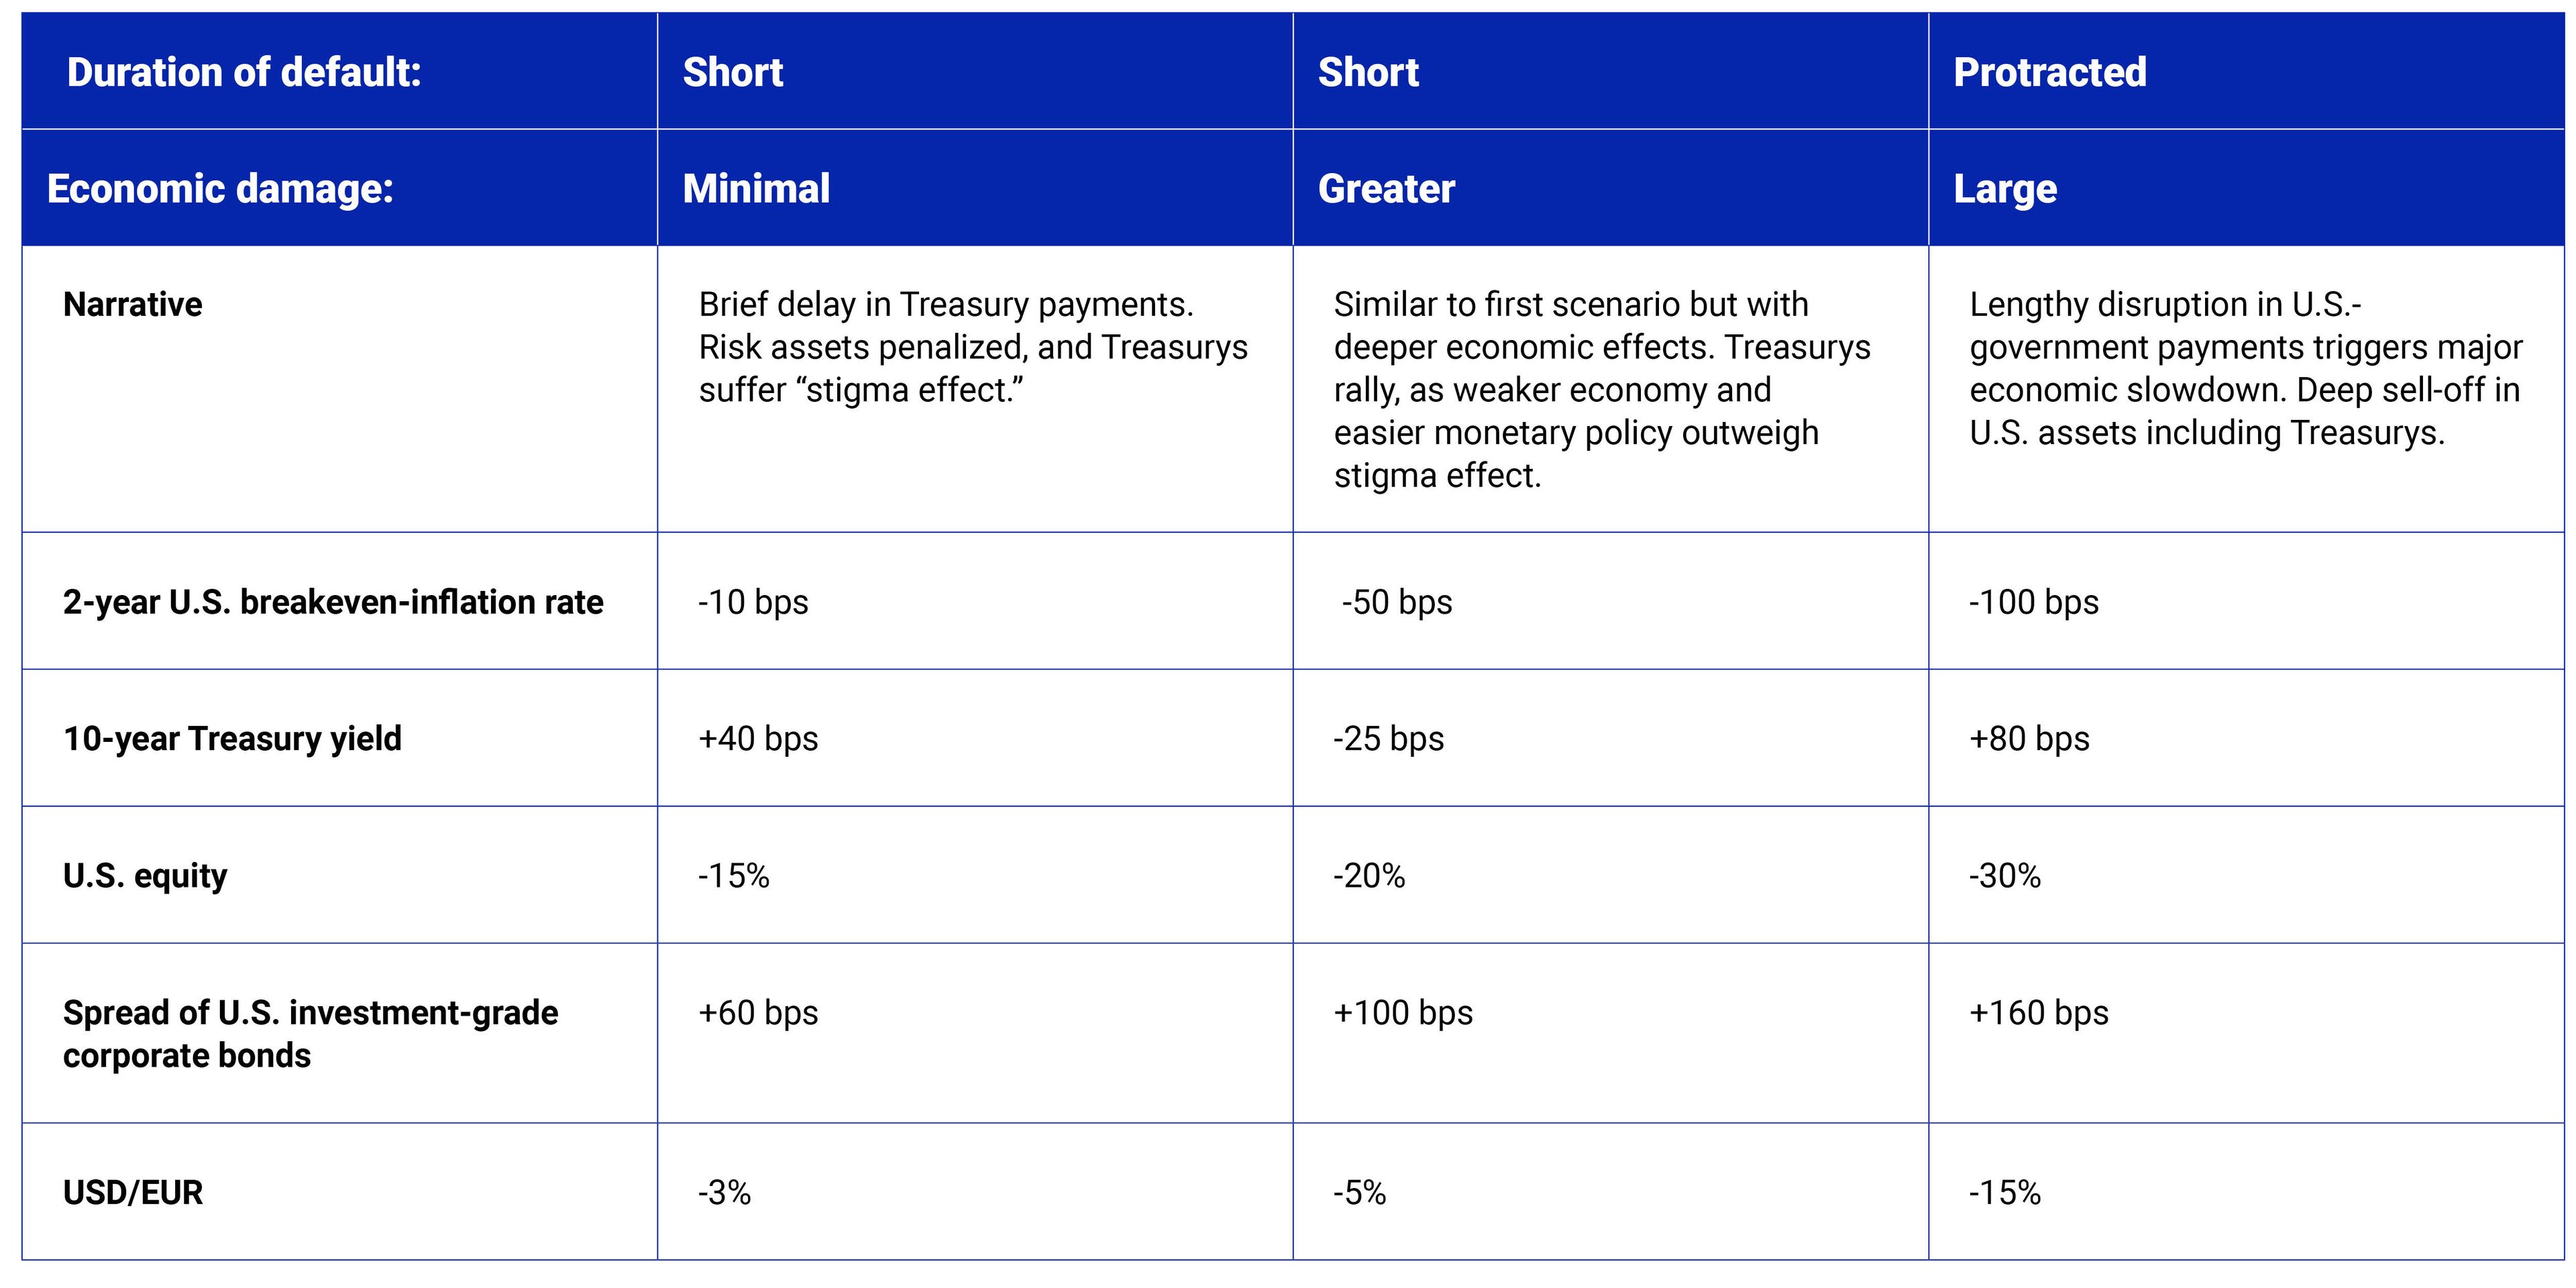
These scenarios are not forecasts, but hypothetical narratives of how a U.S. default could affect multi-asset-class portfolios.


Subscribe todayto have insights delivered to your inbox.
Default in Our Stars?
As discussions continue in Washington, D.C., we examine how markets have handled the uncertainty so far, how such showdowns played out in the past and three “what if” default scenarios.
The CDS Market’s View on US Default
There is growing investor concern that the U.S. could default on its debt obligations. As the debt-ceiling debate heats up, we look at the spreads of credit-default swaps as a measure of the U.S. government’s creditworthiness.
Will the US Government Default?
The debt-ceiling debate has heated up in Congress, and the U.S. government’s ability to borrow could be exhausted sometime between July and September. But what does the market for credit-default swaps say about the likelihood of U.S. default?
1 As calculated by MSCI and based on credit-default-swap spreads from S&P Global Market Intelligence.', 'For the scenario of a short technical default with minimal economic damage, we assumed market shocks similar to those observed in 2011, with the exception that Treasury yields, which dropped in 2011, increase in this scenario.', 'The “protracted default” scenario is based on an analysis from the Federal Reserve: Eric Engen, Glenn Follette, and Jean-Philippe Laforte. “Possible Macroeconomic Effects of a Temporary Federal Debt Default.” Federal Reserve, Oct. 4, 2013.', 'MSCI clients can access BarraOne® and RiskMetrics® RiskManager® files for these scenarios on the client-support site.
The content of this page is for informational purposes only and is intended for institutional professionals with the analytical resources and tools necessary to interpret any performance information. Nothing herein is intended to recommend any product, tool or service. For all references to laws, rules or regulations, please note that the information is provided “as is” and does not constitute legal advice or any binding interpretation. Any approach to comply with regulatory or policy initiatives should be discussed with your own legal counsel and/or the relevant competent authority, as needed.