
Q2 2026 Private Capital Benchmarks SummaryYour guide to clarity in private assets.
Venture capital took off in Q2 2026, benefiting from rising valuations among a handful of large, AI-linked companies. Returns in buyout came back to positive territory after a first-quarter blip, but without the same AI tailwinds, couldn’t keep pace with venture capital. Amid the brighter picture on returns, distributions remained constrained, however.
We examine these trends using data on more than 15,500 closed-end funds globally in the latest edition of our quarterly report.
Highlights:
- The quarterly return for venture capital reached 12.7% in Q2, the strongest showing for the asset class in five years. That helped lift the return for private equity to 5.6%, outpacing private credit and real assets
- Private-equity net cash flow was slightly negative in H1, in contrast to a positive showing from private capital overall. The distribution rate slipped to 9%, extending the frustration of limited partners awaiting cash back.
- Returns in real assets were split, with real estate significantly surpassed by infrastructure and natural resources — asset classes that have been aided by commodity, energy-transition and AI-buildout drivers.
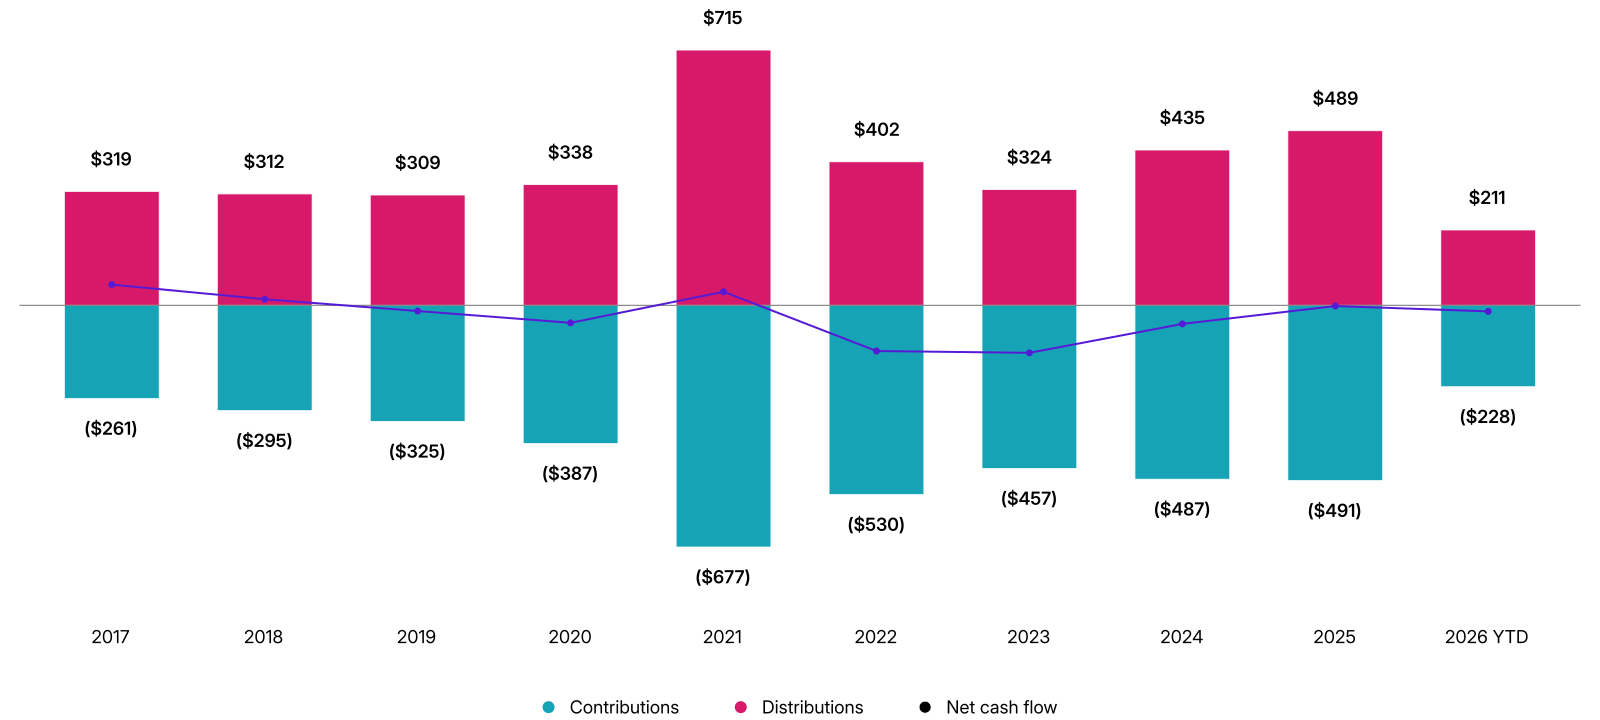
USD billion. Data as of Q2 2026 from the MSCI Private Capital Universe.
Read the full report
Provide your information for instant access to the Q4 2025 Private Capital Benchmarks Summary.
The State of Private Markets 2026
Our research examines the key forces influencing private markets, putting MSCI data and expert insight behind the themes that matter to asset owners, general partners and wealth investors.
Scenario Analysis: Tracing Credit Stress Across Private and Public Market
Two stagflationary scenarios — private-credit contagion and hyperscaler repricing — each produce ~11% portfolio losses but through different channels. Identifying which dominates matters more than the headline loss.