

Charting private assetsWeekly visualizations
Turning MSCI's independent, LP-sourced data into clear insight on the trends shaping private markets today.
Featured charts
A curated view of the charts driving the private markets conversation right now.
October 13, 2026
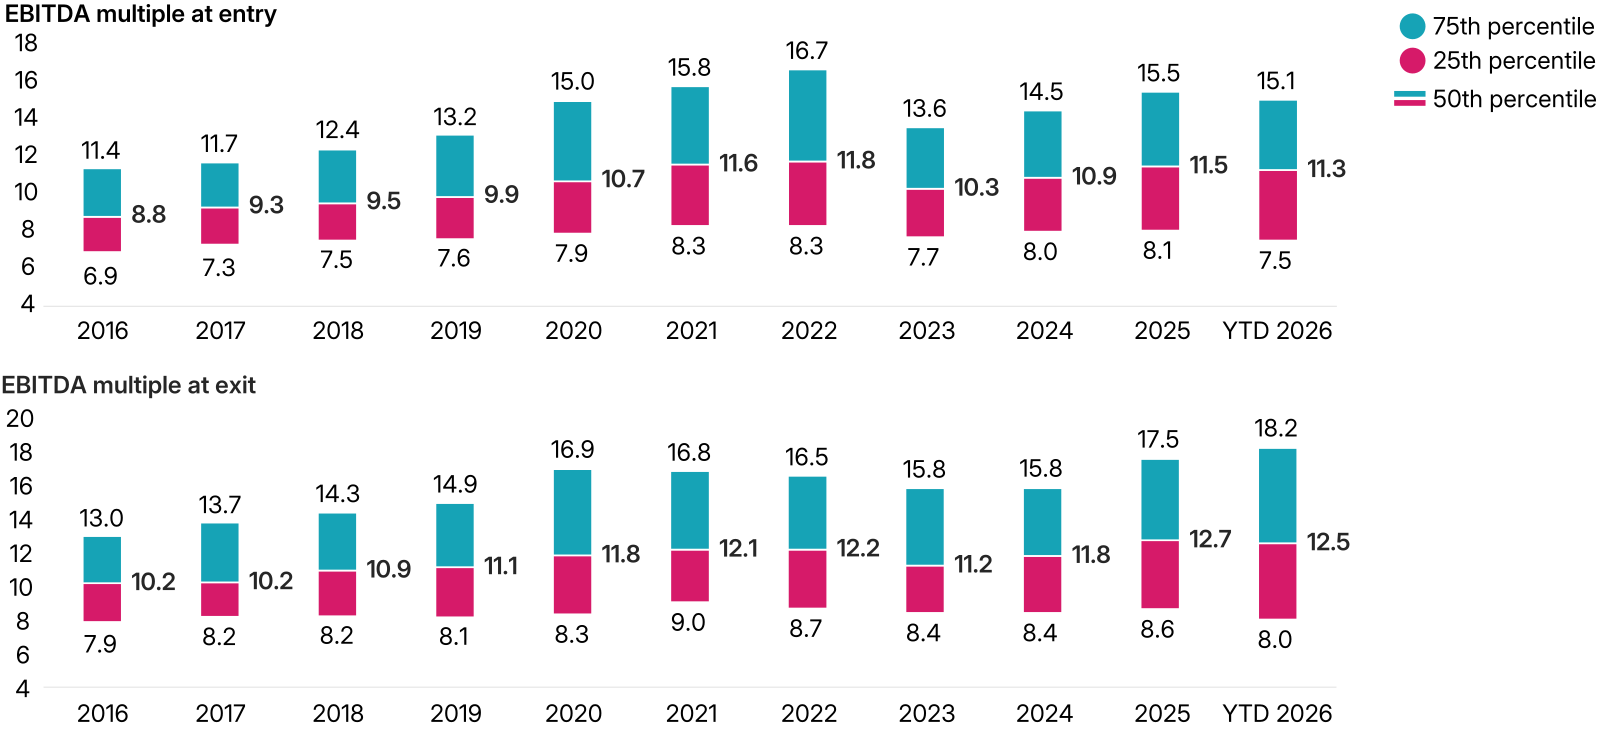
Buyout exit multiples reached their highest level in nearly a decade in the first half of 2026. Top-quartile exits hit 18.2x EBITDA - the highest point in this data series back to 2016 - even as the median held broadly stable at 12.5x. The exit-to-entry spread, at roughly 1.2x, sits near its widest in several years, pointing to a supportive pricing environment for managers willing to transact.
September 29, 2026
The IPO has long been read as the moment private investors hand the baton to public markets and recover their capital. That reading has always been imprecise. Lock-up periods, staged secondary sales and the ambitions of the companies themselves mean the journey from filing to limited-partner cash takes at least quarters, but often years.
September 15, 2026
Private-capital investments in data centers and the businesses that support them outperformed private equity overall for a third consecutive quarter in Q1 2026, as continued investment in AI infrastructure drove a divergence between the two.
September 1, 2026
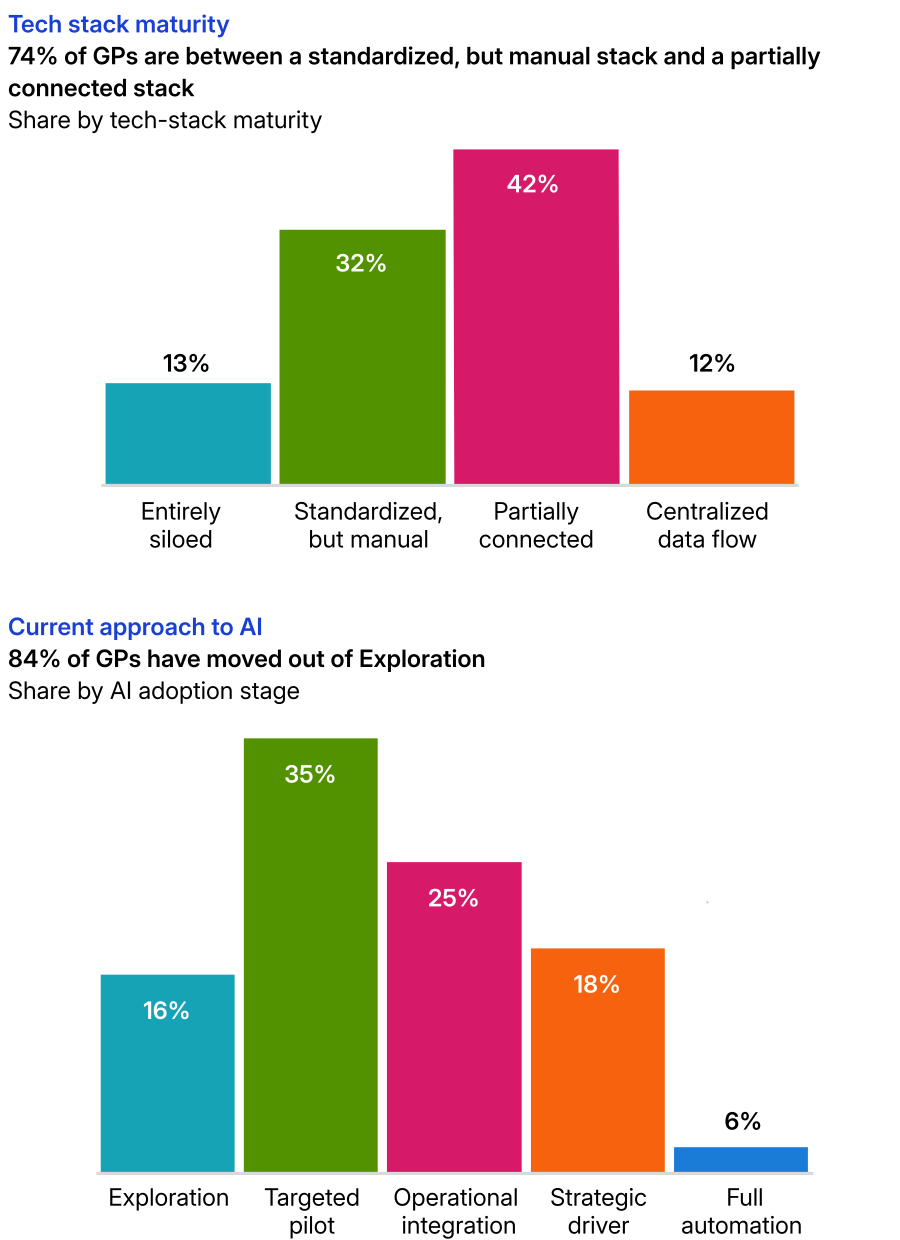
84% of GPs have advanced past the exploration phase of AI adoption, 35% are running targeted pilots, 18% consider AI a strategic driver for investment decisions and 6% have reached full automation. The direction of travel is clear. The underlying foundations, however, have not evolved at the same pace.
Solutions and insights
Practical tools and independent research to help you navigate private markets with confidence.
Total Portfolio Solutions
Answer the questions your board is already asking, with total portfolio visibility across public and private holdings.

Can you see your total portfolio?
Exposures, liquidity and concentrations don't respect asset-class boundaries. As private markets grow, seeing across public and private assets is becoming essential to understanding the portfolio as a whole.

Chart library
The full Charting Private Assets archive, spanning every asset class and theme covered.