
Buyout holdings face leverage challenges
Chart • August 29, 2025
In another sign of pressure in private equity, debt comfort levels in buyout holdings have deteriorated.
By Q1 2025, roughly 55% of buyout holdings sat in the tight, tapped-out or breach zones of their leverage cap, a limit to manage borrowers’ risk. The squeezed leverage could hamper the growth options for portfolio companies — and their private-equity owners.
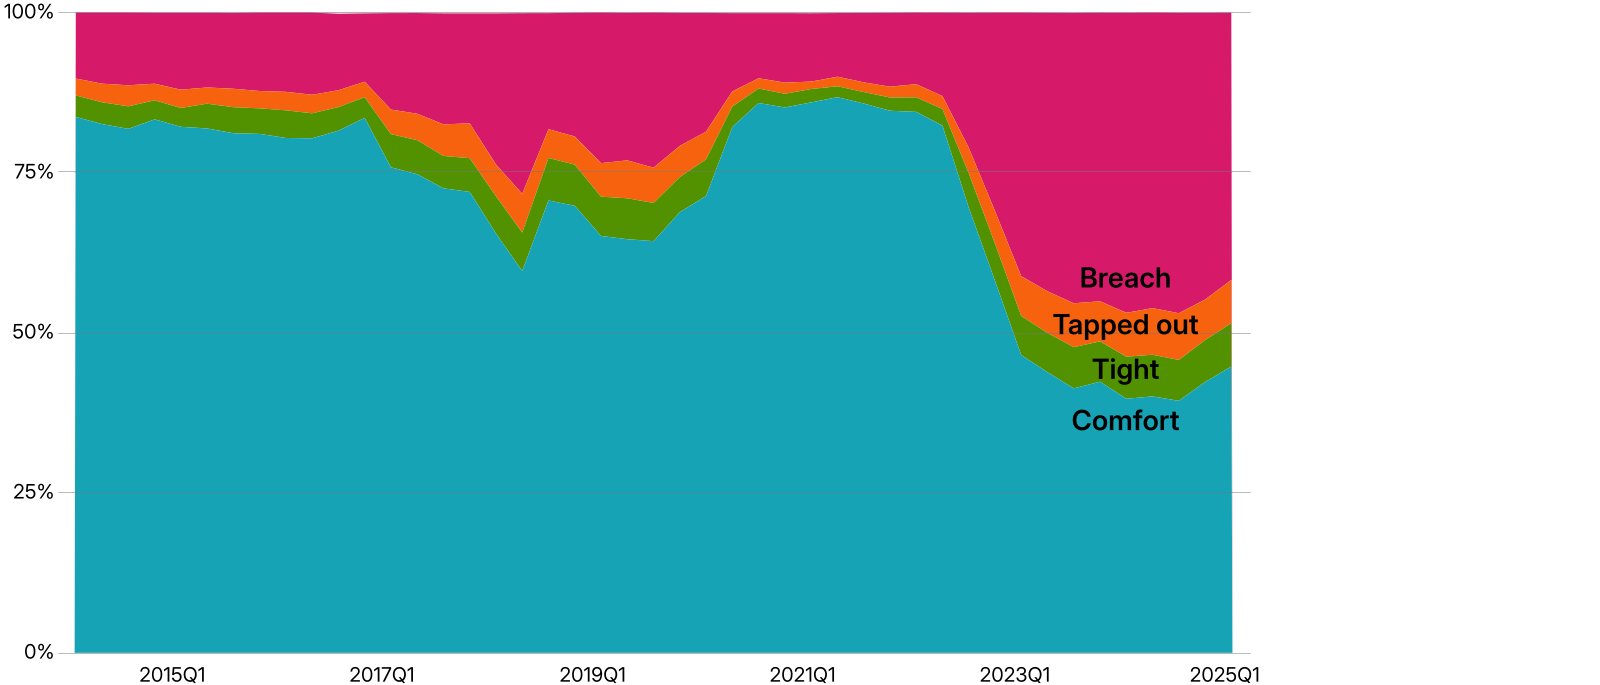
Data as of Q1 2025. Bands: Breach (headroom < 0 turns); tapped out (headroom = 0-0.5 turns), tight (headroom = 0.5-1 turns), comfort zone (headroom ≥ 1 turn). Leverage-cap and headroom calculations use base rates data and private-debt cash spreads, net debt and EBITDA data. Source: Federal Reserve Bank of St. Louis’s FRED, MSCI Private Credit Security Terms, MSCI Private Capital Universe