
Distress in U.S. commercial real estate shifts into lower gear
Distress in U.S. commercial real estate shifts into lower gear
Chart • August 20, 2025
In this chart
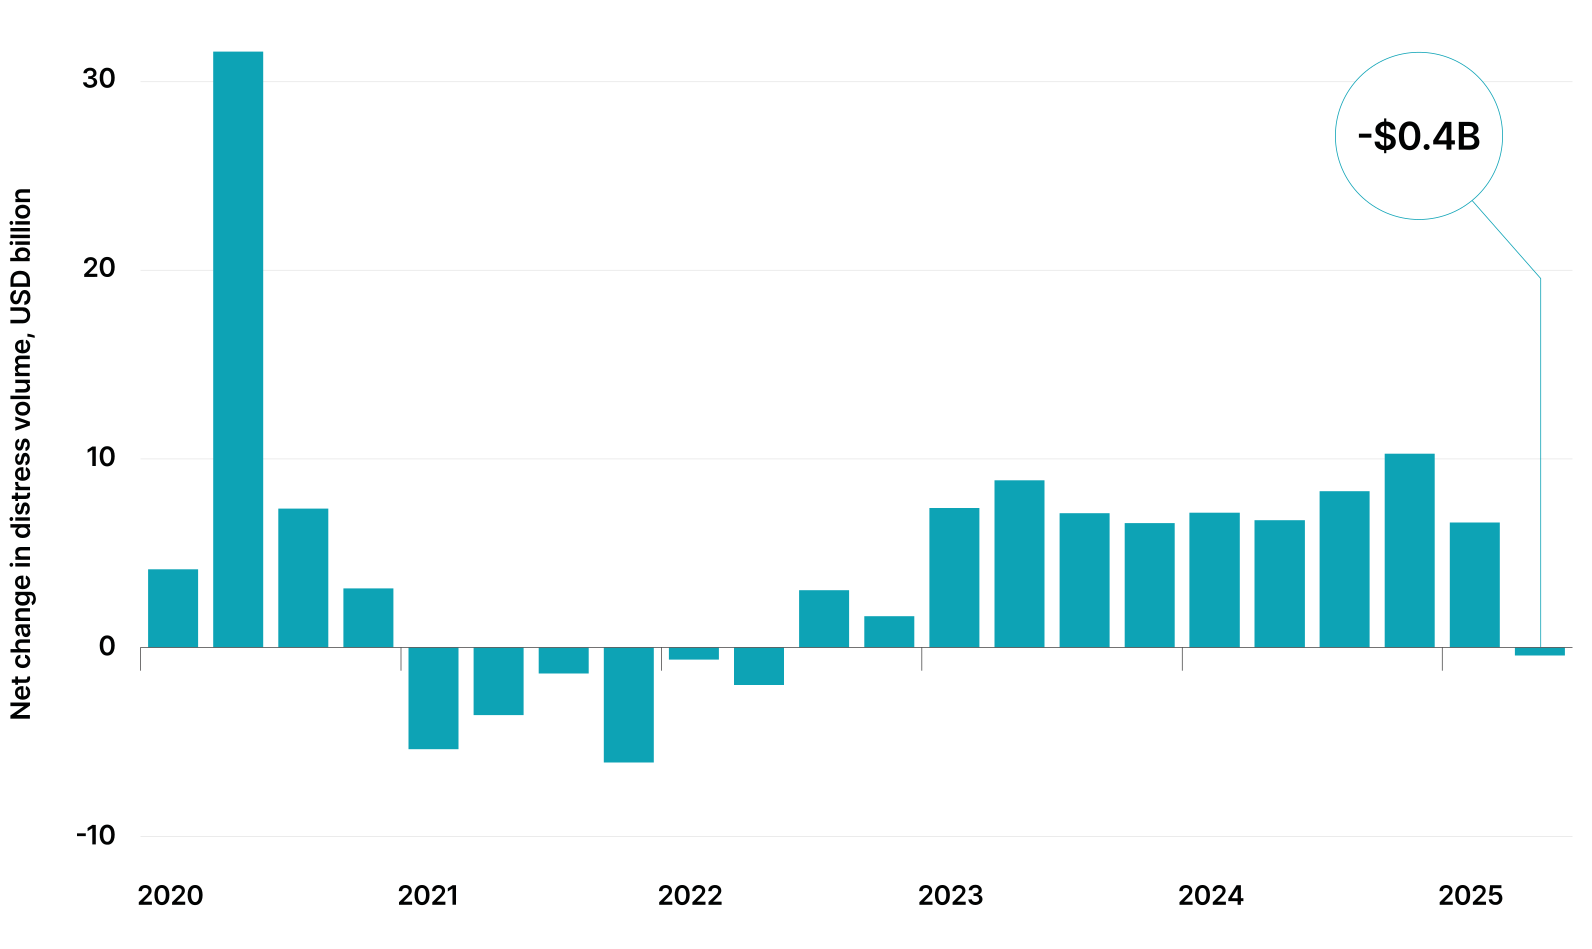
The outlook for distress in U.S. commercial property improved in Q2 2025, with more financial trouble resolved than added in the quarter.
Still, the market is far from out of the woods. The total value of property-related distress remained near the highest level since the aftermath of the GFC, with more than USD 100 billion of distress yet to be worked out by lenders and owners. The office segment is particularly impacted, presenting both ongoing risks and potential opportunities for well-positioned investors.
Source: MSCI Mortgage Debt Intelligence