
Private-credit stress falling harder on smaller funds
Chart • May 28, 2026
In this chart
Stress in private credit is not distributed evenly. Since interest rates began rising, write-down rates have climbed faster at smaller funds than larger ones — and the gap has widened.
In Q3 2025, nearly 20% of loans in smaller funds were marked below 80% of principal, a rough threshold for distress. For larger funds, the share was 13%. The divide is sharper still for severe impairments: Smaller funds had around 13% of loans marked below 50% of principal, while larger funds were in the high single digits.
These marks do not necessarily signal imminent losses. But the pattern points to a growing and uneven distribution of credit stress that makes manager selection and an understanding of portfolio construction increasingly important for allocators.
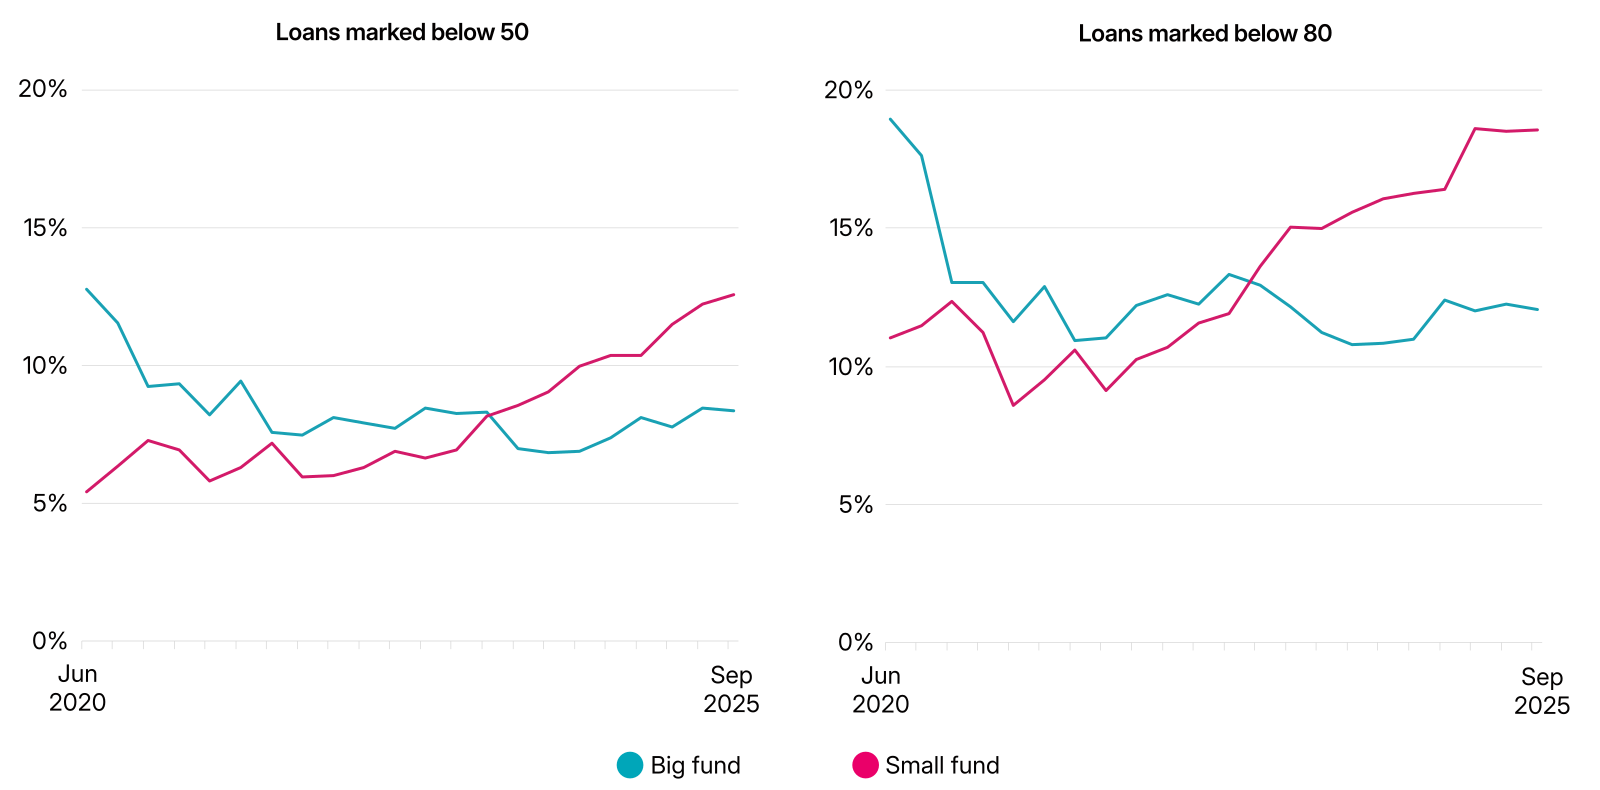
Share of loans with fair-value write-downs. Funds with committed capital greater than or equal to the median for their sub-strategy (e.g., direct lending, real-estate debt) and vintage are considered "big funds," while those below the median are small. MSCI Private Capital Transparency data through Q3 2025, as of May 2026 update.
For more on the growth of private credit and current tensions, explore The State of Private Markets 2026: