
Anthropic and the History of Headline IPOs
- U.S. listings fell from about 330 a year in the late 1990s to about 100 a year since, yet each era produced nearly as many long-lasting companies, indicating higher-quality listings since 2000.
- The listing drop-off came from "regular" IPOs, half of which left the index within four years. Spin-offs and headline IPOs, the larger and more seasoned entrants, lasted far longer.
- Index-based investors seem unaffected by the decline in IPOs. The entrants that lasted accounted for a disproportionate share of wealth creation, suggesting that the kind of company arriving matters more than the count.
Mentioned in this blog post:
Does the U.S. have a listing gap? The number of listed companies roughly halved between 1996 and 2012, and IPO counts have struggled to return to their 1990s pace. The decline was steepest among small companies.1 Yet U.S. equities have outpaced the rest of the world since the 2008 global financial crisis. In The Price of US Exceptionalism, we noted that about 3% of listed firms accounted for three-quarters of the value the U.S. market has added since 2009.
If fewer companies were listing, where did the new winners come from?
The question is timely. Anthropic has filed to go public at a reported valuation near USD 1.4 trillion,2 following SpaceX's listing in June 2026. The global center of IPO activity has also moved. Hong Kong led venues by proceeds in 2025,3 and India led by number of deals. We tracked every company that entered the MSCI USA IMITM Index, which today covers about 99% of U.S. free-float-adjusted market capitalization, from 1995 to 2026, to see which new listings contributed most to the index's total return.
From 1995 to 2000 the U.S. market took in about 330 new listings a year. Since 2001 that annual number has dropped to 100. Yet only one in eight of the 1995–2000 listings lasted a decade in the index, versus nearly one in three since, so the supply of long-lasting companies has held up.
Almost all of the decline is in small listings, as the chart below shows. Index constituent counts also shifted in 2002, when MSCI raised its coverage target for market capitalization. Counting new listings by year of entry avoids that break.
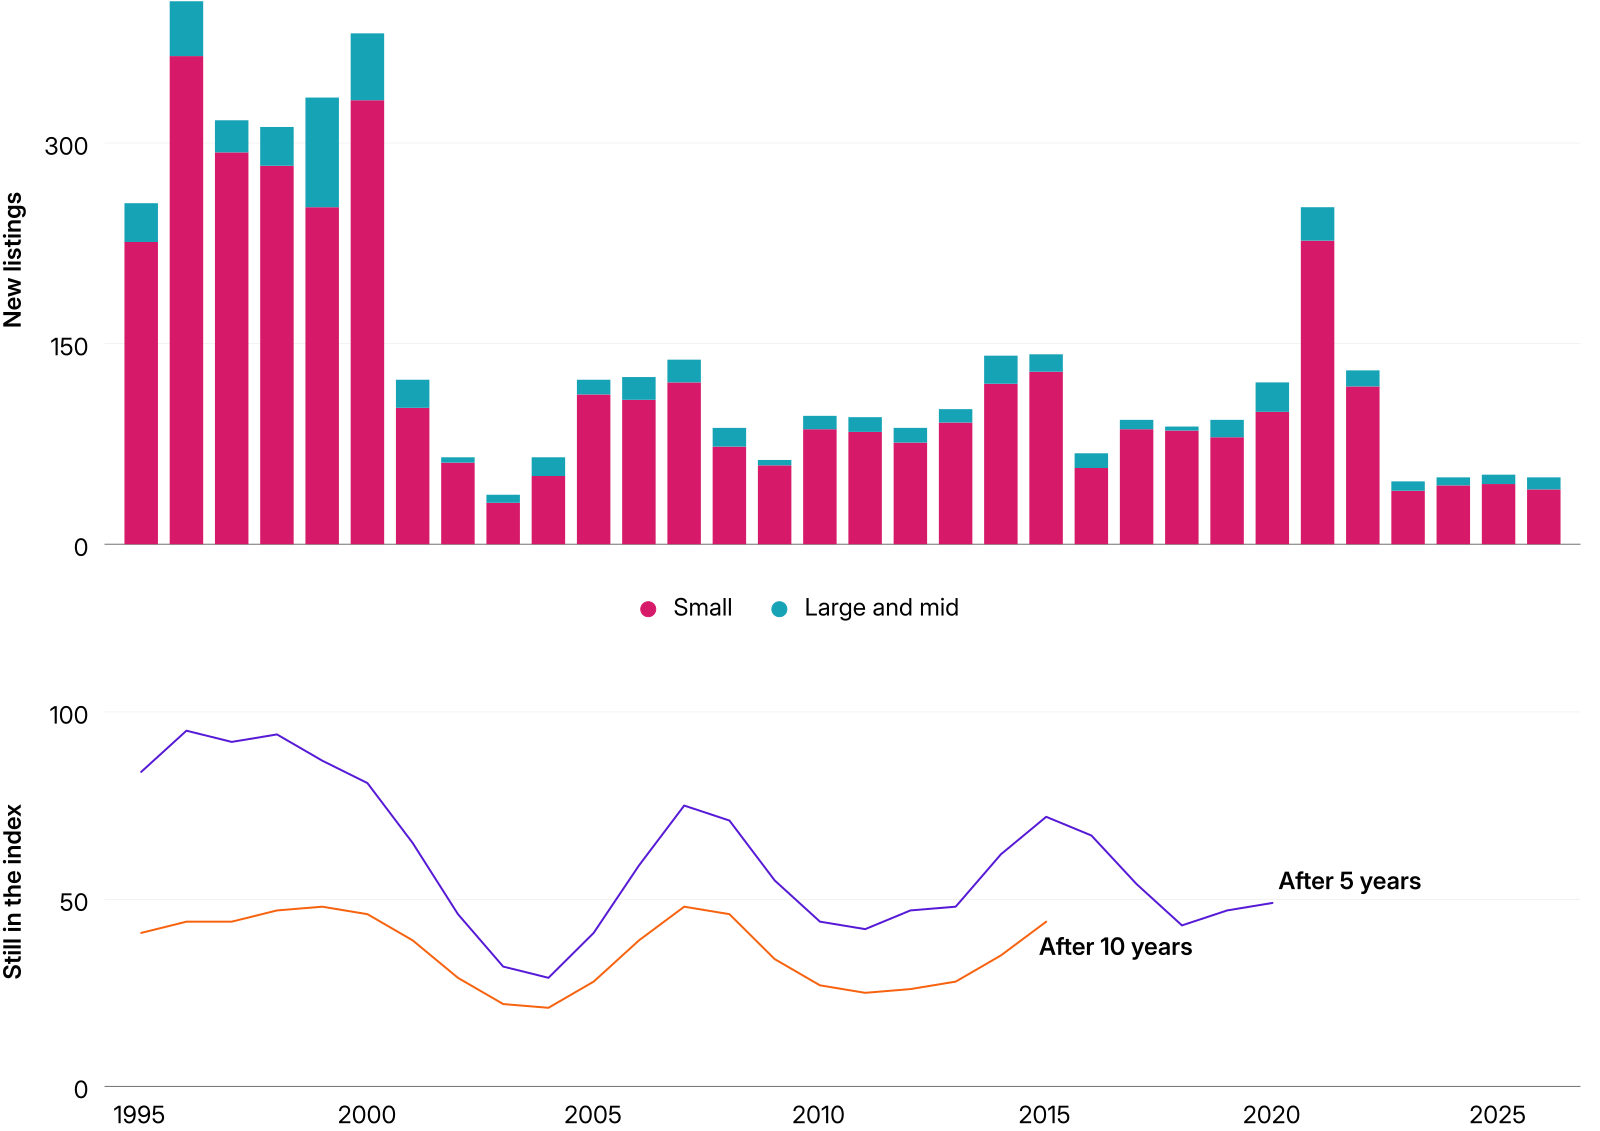
Bars represent companies entering the MSCI USA IMI Index within a year of first trade, by year of entry and size segment at listing. Lines represent the number from each year's cohort still in the index five and 10 years later, shown only for vintages that have reached each horizon.
We grouped the roughly 5,400 companies that entered the MSCI USA IMI Index between 1995 and 2026 by how they got in. MSCI began flagging IPO and spin-off additions in 2003, so those cohorts start then. Regular IPOs start in 1995. Companies admitted more than a year after first trade, and micro caps, are excluded.
Headline IPO: New listings MSCI flagged as IPO additions when they entered the index, all mid or large cap at listing. Some were fast-tracked under the early-inclusion rule. About 100 companies.
Spin-off: Companies flagged as spin-offs, added at separation from an already-listed parent. The company is new to the index but its business is seasoned. About 320 companies.
Regular IPO: Unflagged new listings admitted at a quarterly review within a year of first trade. Nearly 5,000 companies.
Companies that entered the MSCI USA IMI Index since 1995 represent about 40% of its capitalization today, roughly USD 28 trillion of a USD 71 trillion market. Regular IPOs account for most of that market, because there were more than 10 times as many of them as the other two cohorts combined. Headline IPOs and spin-offs are fewer than 8% of new listings by count, yet together they are about 14% of index capitalization, a third of all the weight new listings hold. Regular IPOs make up the remainder.
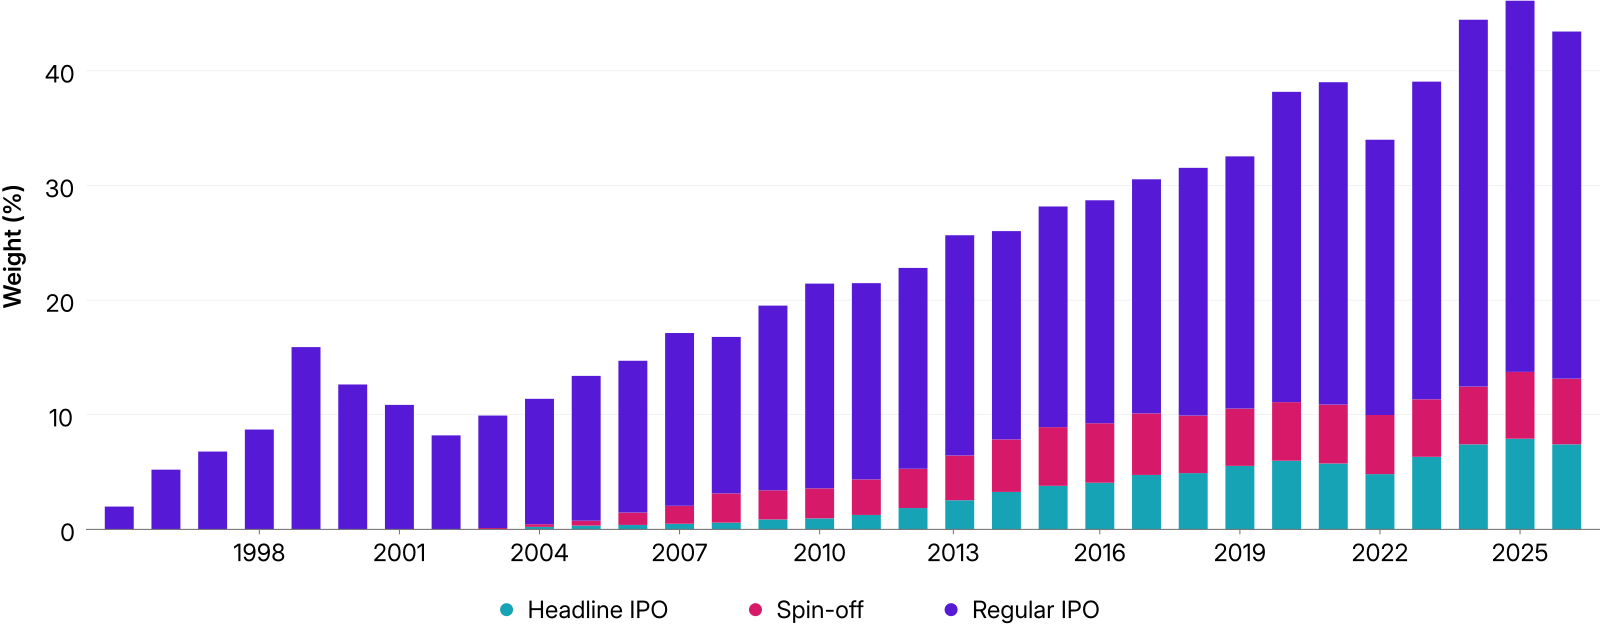
Cumulative weight by listing cohort, 1995–2026, in the MSCI USA IMI Index.
Half of regular IPOs had left the index within four years of entry, through delisting, bankruptcy or takeover. Spin-offs lasted nearly three times as long, at a median of 10 years. More than half of headline IPOs are still in the index today.
Fama and French found survival rates among new listings weakening through the 1980s and 1990s.4 Our analysis shows the attrition concentrated in regular IPOs, whose median lifetime was about a third of the other cohorts. Restarting the analysis after 2002, to strip out the dot-com fallout, left the results largely intact.
We next lined up each stock by years since it entered the index and compounded its returns for 10 years. Every cohort was lackluster in its first three years, the pattern Ritter documented over three-to-five-year horizons.5
The back half of firms' first decade favored spin-offs and headline IPOs, as weaker names delisted and the survivors were larger firms with established operating models. The median regular IPO spent most of the decade below its starting value. By the 10-year mark more than 40% of headline IPOs had beaten the broad market, against about a third of regular IPOs.6
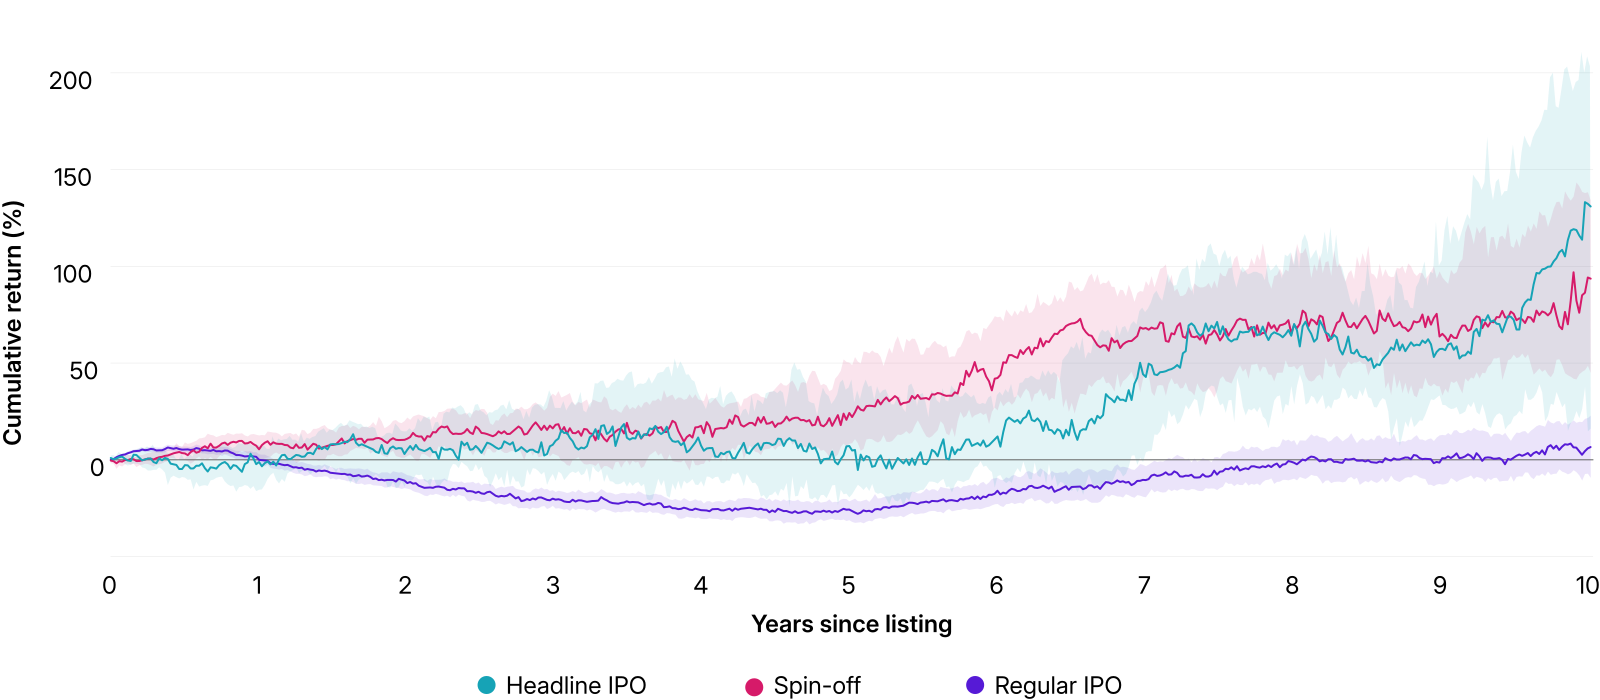
Median return of cohort indexed to first trade. Bands are 95% confidence intervals. Returns are gross in USD from 1995–2026.
To keep attrition from driving the comparison, we measured each cohort's factor exposures at a comparable age, its own median half-life, using the MSCI USA Equity Factor Model.7
Regular IPOs relied on high growth and high investment to fund that growth, with weak profitability, volatile earnings and volatile returns, and short sellers targeted them more than the other cohorts. Spin-offs and headline IPOs showed the opposite profile: lower growth and lower investment, pointing to capital discipline, alongside cheaper valuations and steadier earnings and returns. Headline IPOs and spin-offs arrived as larger, higher-quality companies, and a decade later the fundamentals still reflected it.
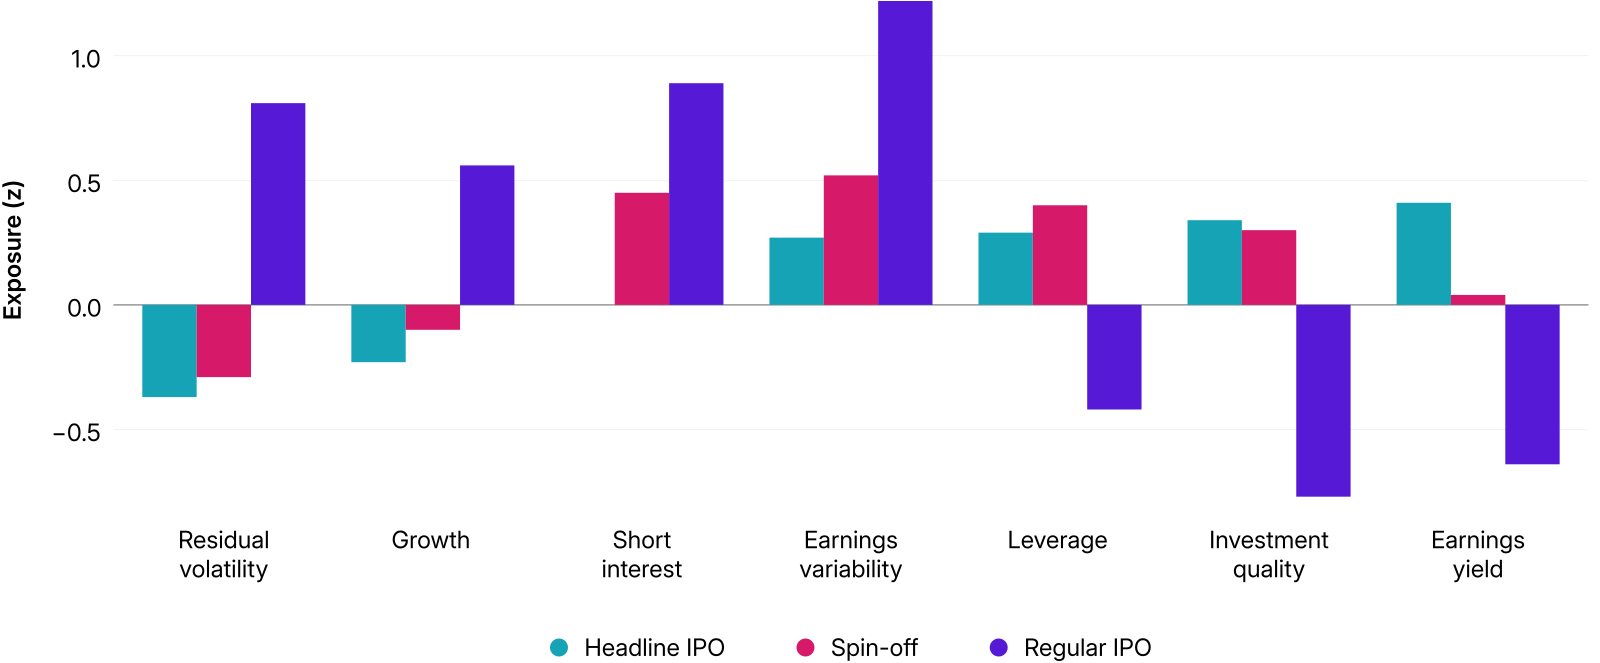
Values are median exposure using the MSCI USA Equity Factor Model, current generation, measured at each cohort's comparable age.
We added incumbents, stocks already in the MSCI USA IMI at the start of 1996, to measure each group's share of wealth creation over 30 years. Incumbents were about half the names and over 70% of the wealth created since 1996.
Regular IPOs accounted for less than 20% of wealth creation, and even that was concentrated in Nvidia (1999), Google (2004) and Amazon (1997). Headline IPOs punched hardest above their weight, only 1% of names but nearly 5% of wealth creation.
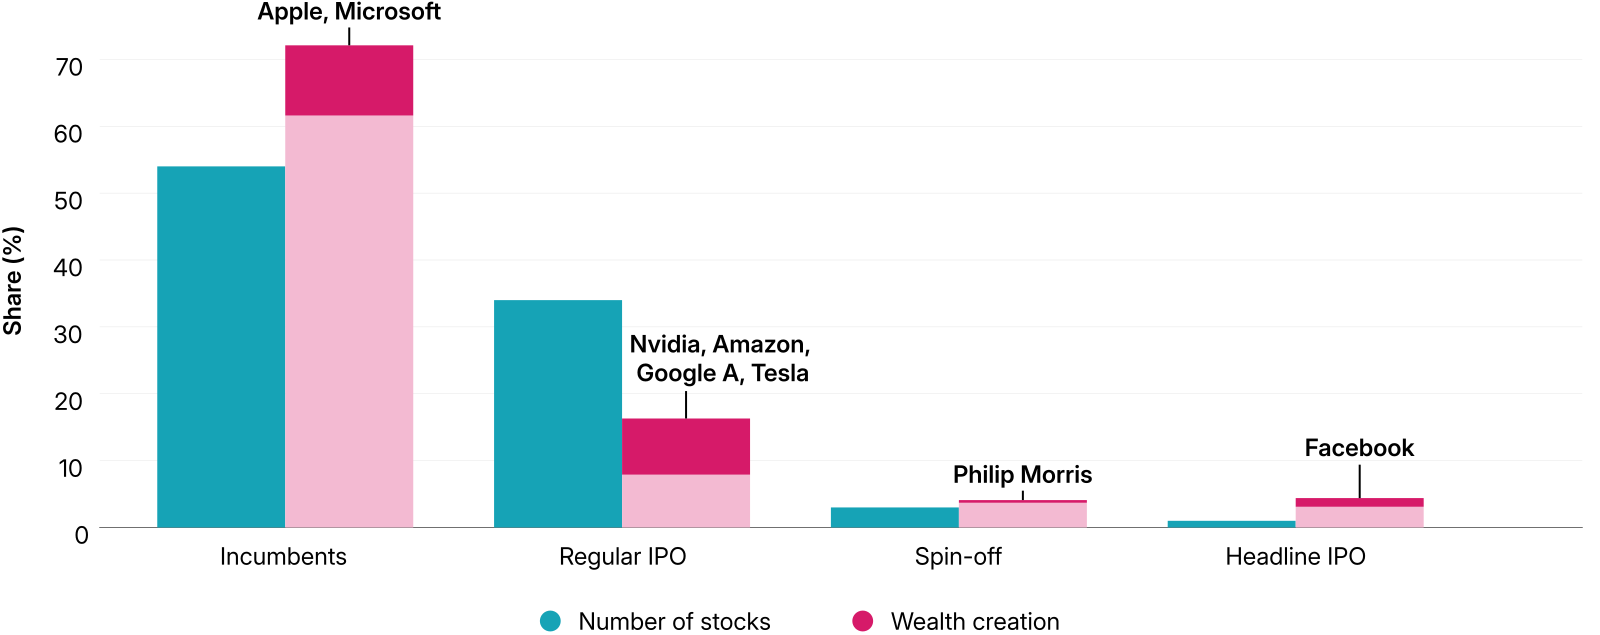
Wealth creation is the firm's total contribution to the MSCI USA IMI Index's gross return, 1996–2026. Philip Morris International enters as a spin-off, when Altria separated and listed its international business.
Index-based investors were not hurt by the post-2000 decline in listings. The supply of long-lived companies held up, and headline IPOs and spin-offs created more than their share of wealth. Regular IPOs lagged as a class, with half gone from the index within four years, but the same cohort produced Amazon and Nvidia and accounts for about a quarter of the index's capitalization today. Capturing winners like these meant owning new entrants from the start.
Whether this holds in Hong Kong and India is an open question, since issuer mix, float and investor base differ. For allocators, the U.S. record points to two checks on any index: how quickly it admits large new listings and whether its small-cap coverage is broad enough to capture future leaders from entry.


Subscribe todayto have insights delivered to your inbox.
MSCI USA IMI Index
The MSCI USA Investable Market Index (IMI) is designed to measure the performance of the large, mid and small cap segments of the US market. The index covers approximately 99% of the free float-adjusted market capitalization in the US.
The Anatomy of US Equities
Roughly 60% of U.S. equity value sits in companies that went public after 1975. With USD 3.2 trillion of large private U.S. firms in the IPO pipeline, how fast an index adds them matters.
New Listing, No History: Estimating the Risk of an IPO
When a stock has no return history, how do you estimate its risk? MSCI’s latest factor model fills the gap with smart proxies from peers — starting day one.
1 Craig Doidge, G. Andrew Karolyi and René M. Stulz, "The U.S. listing gap," Journal of Financial Economics, March 10, 2017. Xiaohui Gao, Jay R. Ritter and Zhongyan Zhu, "Where Have All the IPOs Gone?" Journal of Financial and Quantitative Analysis, Jan. 17, 2014.
2 Tim Bradshaw, “Anthropic targets valuation of up to $1.4tn in IPO,” Financial Times, Nov. 10, 2026.
3 "EY Q4 2025 Global IPO Trends," EY, December 2025.
4 Eugene F. Fama and Kenneth R. French, "New lists: Fundamentals and survival rates," Journal of Financial Economics, August 2004.
5 Jay R. Ritter, "The Long-Run Performance of Initial Public Offerings," Journal of Finance, March 1991. Tim Loughran and Jay R. Ritter, "The New Issues Puzzle," Journal of Finance, March 1995.
6 David Autor, David Dorn, Lawrence F. Katz, Christina Patterson and John Van Reenen, "The Fall of the Labor Share and the Rise of Superstar Firms," Quarterly Journal of Economics, May 2020.
7 The MSCI USA Equity Factor Model measures each stock's exposure to common drivers of return, such as size, value, growth and volatility, and uses them to explain and forecast portfolio risk.
The content of this page is for informational purposes only and is intended for institutional professionals with the analytical resources and tools necessary to interpret any performance information. Nothing herein is intended to recommend any product, tool or service. For all references to laws, rules or regulations, please note that the information is provided “as is” and does not constitute legal advice or any binding interpretation. Any approach to comply with regulatory or policy initiatives should be discussed with your own legal counsel and/or the relevant competent authority, as needed.