Biodiversity Footprinting: Measuring a Portfolio’s Impact on Species Loss
Key findings
- While there was variation by sector, investors with exposure to Latin America might be financing larger biodiversity footprints than those exposed to other markets, based on analysis of the relevant MSCI regional indexes compared to the MSCI ACWI Investable Market Index (IMI).
- Biodiversity footprint metrics could help institutional investors quantify the impacts of their portfolios on potential species loss, as they build and manage portfolios.
- Investors could face growing pressure to assess and report their biodiversity impacts from voluntary reporting frameworks such as the TNFD or regulations that might be adopted in the wake of COP16.
While there is no standard market approach to biodiversity footprinting, the Potentially Disappeared Fraction of Species (PDF) is a commonly used metric that indicates a company's potential contribution to global species loss, [1] and could be used for reporting on the TNFD's Core Disclosure Metrics.[2] We calculated the PDF for each company within each index based on the pressure caused by a company related to its land use, greenhouse gas (GHG) emissions and water consumption from its direct operations.[3] It's important to note that a company's contribution to global species loss is driven not just by the extent of the pressures but also where the pressures occur. In biodiversity-sensitive regions, land use and water consumption tended to have higher impacts on biodiversity. We factored these location-specific conditions into our biodiversity footprint metrics.
We found that the constituents of the MSCI Emerging Markets Latin America Index had the highest biodiversity footprint per enterprise value including cash (EVIC),[4] and clearly exceeded the global benchmark of the MSCI ACWI IMI. In contrast, biodiversity loss by the constituents of the MSCI USA and MSCI Europe Indexes was relatively low.[5]
Total global PDF per total EVIC
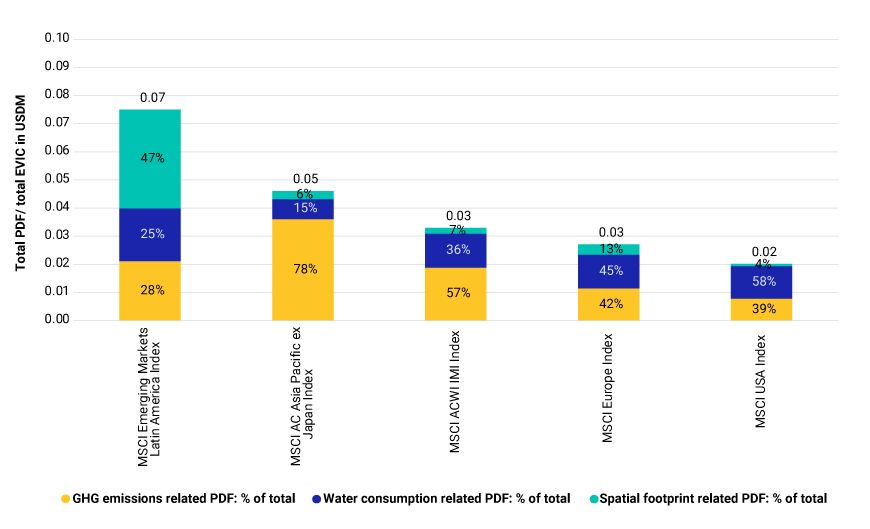
Data as of Sept. 30, 2024. Figure shows the total global PDF of index constituents divided by the total EVIC of index constituents. We excluded constituents from the calculation where no PDF data was available. Source: MSCI ESG Research
What is driving biodiversity loss?
The drivers of biodiversity footprints differed by region. We found that land use was the dominant pressure category in Latin America (47% of total PDF on average), while GHG emissions dominated in Asia Pacific (78%) and water consumption in the U.S. and Europe. These finding resonate with the biodiversity sensitive nature of many Latin American regions. Operating factories or plantations in the species-rich Amazon or Cerrado regions, for example, creates greater pressures on biodiversity than physical assets in urbanized areas in Europe or the U.S. Investors who want to engage with companies in their portfolios might focus on related pressure categories as they seek to lower negative impacts from their investments.
Intensity-based PDF analysis
Normalizing biodiversity footprints by revenues could provide further insights on a company's relative contribution to species loss, focusing on the company fundamentals rather than market valuation. How many species might be at extinction risk for every USD of revenue generated by the constituents in each index? As shown in the exhibit below, companies in Latin America had the highest average footprint intensity (0.15 PDF/USDm revenues), followed by those in Asia Pacific (ex. Japan), both exceeding the global benchmark (MSCI ACWI IMI). Conversely, companies in the U.S. and Europe were less exposed to causing species loss in relation to their revenues generated, according to our PDF metric.
What is the biodiversity footprint per USD generated?
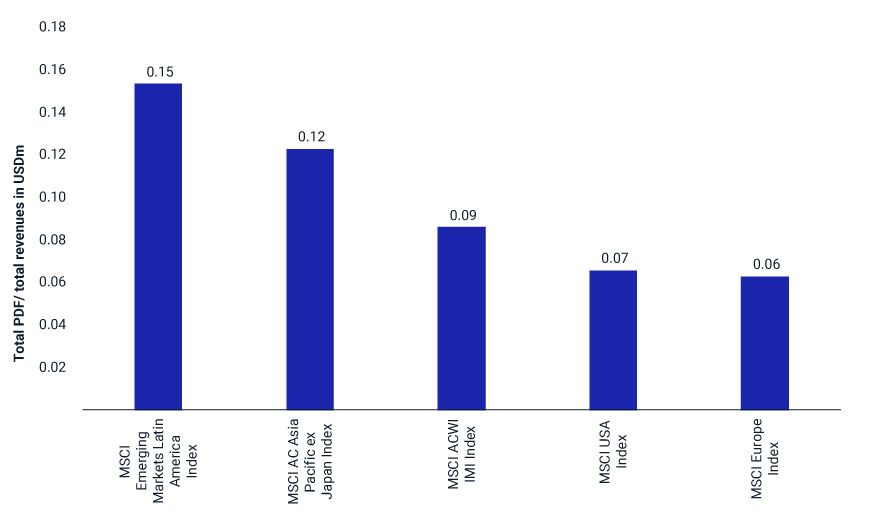
Data as of Sept. 20, 204. We calculated the average PDF intensity per index by dividing total PDF values (MSCI factor: total global potential species extinction) of index constituents by the total annual revenues of the index constituents. We excluded constituents from the calculation where no PDF data was available. Source: MSCI ESG Research
Sector-specific PDF analysis
Our analysis showed the contribution to potential species extinction also varied significantly by sector. Across all indexes, we identified the materials, utilities, energy and consumer-staples sectors as key drivers of high biodiversity footprints.[6] The land-use-, energy- and water-intensive operations of companies in these sectors generally caused greater impacts.
The interactive exhibit below compares index representation (number of sector peers vs. total index constituents) with total contribution to potential species loss by sector. While only 16% of index constituents in Latin America were in the materials sector, they accounted for 70% of the total index footprint. We found comparable results for materials companies in other indexes. The utilities sector's footprint also stood out across indexes. For instance, utilities companies in Asia Pacific (ex. Japan) contributed to 35% of the index footprint while representing only 5% of index constituents. In contrast, sectors such as financials, information technology and health care showed lower contribution to species loss compared to their sector representation. This may be associated with lower GHG emissions and resource use within direct operations and limited presence in biodiversity-sensitive areas.
Index representation vs. biodiversity footprint by sector
Loading chart...
Please wait.
Biodiversity footprinting is a novel concept for investors, yet promising metrics are emerging that can help them identify which companies, sectors or regions contribute most to biodiversity loss, and which drivers are most attributable to these impacts. These tools are expected to further improve as more robust data becomes available and modeling innovation takes place, providing more data to use for benchmarking, reporting or identifying key sectors or companies for engagement.


Subscribe todayto have insights delivered to your inbox.
1 The output of the PDF is a unitless fraction which indicates a company's contribution a global species extinction. To improve readability of the data, we scale the PDF values by the factor 108 (100,000,000). The scaled value may be interpreted as an upper limit to the potentially disappeared number of species. The highest potential PDF value is now 100 million which corresponds with the estimated number of species on our planet (upper range). A PDF of e.g. 1,000 indicates a company's potential contribution to the extinction of 1,000 species in relation to an estimated number of 100 million species on Earth over the course of the next 100 years.2 Taskforce on Nature-related Financial Disclosures (TNFD). 2023. “Recommendations of the Taskforce on Nature-related Financial Disclosures.” The PDF metric could be used to report on the TNFD indicator Species Extinction Risk (C 5.0)3 We currently do not factor in supply chain related impacts due to limited geospatial supply chain data.4 Most-recent available fiscal year-end enterprise value including cash (million USD). EVIC is an alternate measure to enterprise value (EV) to value a company by adding cash and cash equivalents to EV. EV is calculated as total company value (market capitalization, preferred equity, minority interest and total debt) minus cash and cash equivalents; i.e., EVIC = market capitalization at fiscal year-end date + preferred stock + minority interest + total debt.5 Of note, supply-chain impacts are currently not considered in our biodiversity footprint model. Thus, results could change once they can be included.
The content of this page is for informational purposes only and is intended for institutional professionals with the analytical resources and tools necessary to interpret any performance information. Nothing herein is intended to recommend any product, tool or service. For all references to laws, rules or regulations, please note that the information is provided “as is” and does not constitute legal advice or any binding interpretation. Any approach to comply with regulatory or policy initiatives should be discussed with your own legal counsel and/or the relevant competent authority, as needed.