Brexit and the Risks of Home Bias
Net Total Return Performance (%) | Net Total Return Performance (%).1 | Net Total Return Performance (%).2 | Net Total Return Performance (%).3 | Net Total Return Performance (%).4 |
|---|---|---|---|---|
Net Total Return Performance (%) None | Net Total Return Performance (%).1 MSCI UK | Net Total Return Performance (%).2 MSCI World | Net Total Return Performance (%).3 MSCI World IMI | Net Total Return Performance (%).4 MSCI ACWI IMI |
Net Total Return Performance (%) 1 Yr | Net Total Return Performance (%).1 -8.8 | Net Total Return Performance (%).2 -3.0 | Net Total Return Performance (%).3 -3.8 | Net Total Return Performance (%).4 -4.5 |
Net Total Return Performance (%) 3 Yr | Net Total Return Performance (%).1 6.7 | Net Total Return Performance (%).2 11.6 | Net Total Return Performance (%).3 11.6 | Net Total Return Performance (%).4 11.8 |
Net Total Return Performance (%) 5 Yr | Net Total Return Performance (%).1 3.6 | Net Total Return Performance (%).2 10.2 | Net Total Return Performance (%).3 10.1 | Net Total Return Performance (%).4 9.8 |
Net Total Return Performance (%) 10 Yr | Net Total Return Performance (%).1 8.1 | Net Total Return Performance (%).2 11.0 | Net Total Return Performance (%).3 11.3 | Net Total Return Performance (%).4 11.1 |
Net Total Return Performance (%) 20 Yr | Net Total Return Performance (%).1 4.2 | Net Total Return Performance (%).2 5.8 | Net Total Return Performance (%).3 6.3 | Net Total Return Performance (%).4 6.4 |
Concentration Metrics | Concentration Metrics.1 | Concentration Metrics.2 | Concentration Metrics.3 | Concentration Metrics.4 | Concentration Metrics.5 |
|---|---|---|---|---|---|
Concentration Metrics None | Concentration Metrics.1 Number of Securities | Concentration Metrics.2 Weight of top 5 Sec. (%) | Concentration Metrics.3 Idiosyncratic Risk* | Concentration Metrics.4 Total Risk* | Concentration Metrics.5 Idiosyncratic/total Risk Ratio* |
Concentration Metrics MSCI UK | Concentration Metrics.1 96 | Concentration Metrics.2 29.9% | Concentration Metrics.3 2.6% | Concentration Metrics.4 12.0% | Concentration Metrics.5 22% |
Concentration Metrics MSCI UK IMI | Concentration Metrics.1 364 | Concentration Metrics.2 25.3% | Concentration Metrics.3 2.2% | Concentration Metrics.4 12.0% | Concentration Metrics.5 19% |
Concentration Metrics MSCI World IMI | Concentration Metrics.1 6013 | Concentration Metrics.2 6.8% | Concentration Metrics.3 0.9% | Concentration Metrics.4 13.1% | Concentration Metrics.5 7% |
Concentration Metrics MSCI ACWI IMI | Concentration Metrics.1 8725 | Concentration Metrics.2 6.0% | Concentration Metrics.3 0.8% | Concentration Metrics.4 13.0% | Concentration Metrics.5 6% |
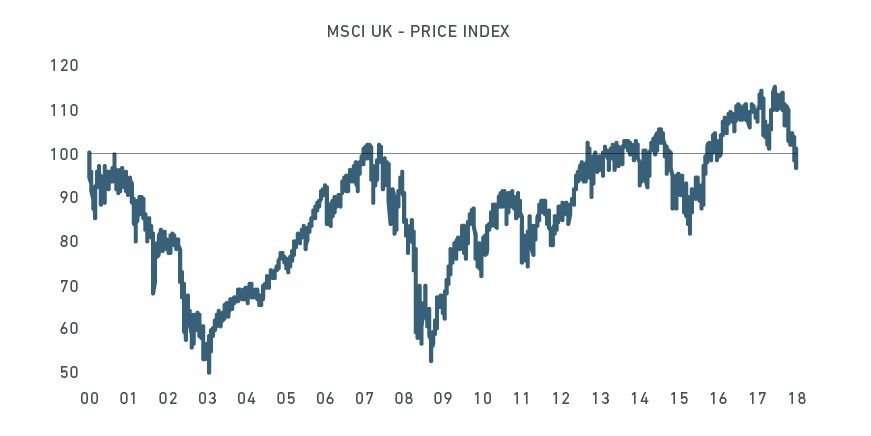
Finally, portfolio theory suggests that institutional investors could benefit from significant risk reduction and return enhancement by venturing out of their domestic markets and capturing the opportunities offered by global equities. With globalization, regional equity markets have converged and seen their correlations rise in recent decades, but individual domestic markets have nonetheless continued to display significant regional variance in their risk and return metrics. Over the past 15 years, a GBP investor in the U.K. market would have benefited by investing in other developed markets, emerging markets and small caps. Over this period, the MSCI United Kingdom Index significantly underperformed MSCI ACWI IMI (6.8% vs. 9.5% annual returns), with a very similar level of volatility (12.6% vs. 13.0%). And ACWI IMI would have offered slightly better downside protection — with, for example, a maximum drawdown of 39.1% for MSCI ACWI IMI, against 45.3% for the MSCI United Kingdom Index.
Unnamed: 0 | MSCI UK | MSCI UK IMI | MSCI World IMI | MSCI ACWI IMI |
|---|---|---|---|---|
Unnamed: 0 Risk/Return Trade-off | MSCI UK Risk/Return Trade-off | MSCI UK IMI Risk/Return Trade-off | MSCI World IMI Risk/Return Trade-off | MSCI ACWI IMI Risk/Return Trade-off |
Unnamed: 0 Total Return* (%) | MSCI UK 6.8 | MSCI UK IMI 7.3 | MSCI World IMI 9.5 | MSCI ACWI IMI 9.5 |
Unnamed: 0 Total Risk (%) | MSCI UK 12.6 | MSCI UK IMI 12.6 | MSCI World IMI 12.7 | MSCI ACWI IMI 13.0 |
Unnamed: 0 Return/Risk | MSCI UK 0.54 | MSCI UK IMI 0.58 | MSCI World IMI 0.75 | MSCI ACWI IMI 0.73 |
Unnamed: 0 Downside Risk Metrics | MSCI UK Downside Risk Metrics | MSCI UK IMI Downside Risk Metrics | MSCI World IMI Downside Risk Metrics | MSCI ACWI IMI Downside Risk Metrics |
Unnamed: 0 Annualized Downside Deviation (%) | MSCI UK 8.4 | MSCI UK IMI 8.4 | MSCI World IMI 8.2 | MSCI ACWI IMI 8.4 |
Unnamed: 0 VaR @ 95% | MSCI UK -6.3 | MSCI UK IMI -6.0 | MSCI World IMI -6.1 | MSCI ACWI IMI -6.0 |
Unnamed: 0 Max Drawdown (%) | MSCI UK 45.3 | MSCI UK IMI 45.6 | MSCI World IMI 38.5 | MSCI ACWI IMI 39.1 |

Subscribe todayto have insights delivered to your inbox.
The content of this page is for informational purposes only and is intended for institutional professionals with the analytical resources and tools necessary to interpret any performance information. Nothing herein is intended to recommend any product, tool or service. For all references to laws, rules or regulations, please note that the information is provided “as is” and does not constitute legal advice or any binding interpretation. Any approach to comply with regulatory or policy initiatives should be discussed with your own legal counsel and/or the relevant competent authority, as needed.