Carbon-Emissions Data to Inform the MBS Market
- U.S. real estate investors may increasingly seek data on residential emissions to help estimate the financed emissions of their holdings in mortgage-backed securities or property loans.
- Our estimates of carbon emissions for residential properties in each U.S. state indicate strong regional differences in absolute emissions and in the drivers of these emissions.
- Residential Scope 1 emissions are higher in the Northeast; Scope 2 emissions are higher in the Midwest, due to high grid-emission intensities, and in some Southern states, due to higher electricity consumption per square meter.
Higher emissions in the Midwest than other regions
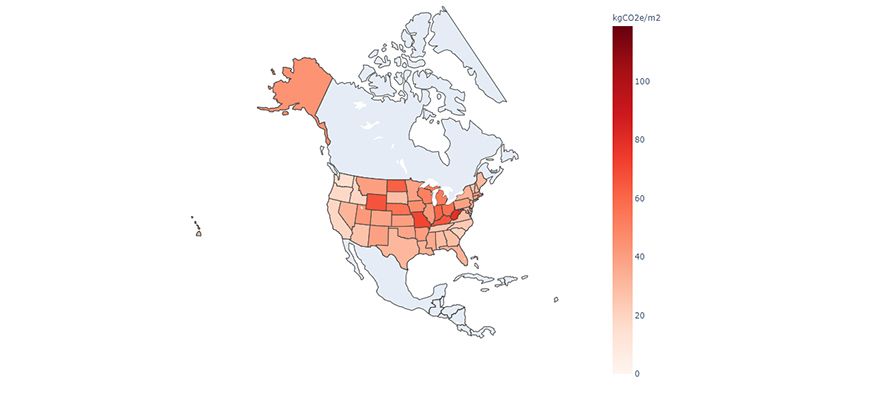
U.S. residential real estate's CO2-equivalent emissions (Scopes 1 and 2) per square meter by U.S. state (kgCO2e/m2). Data as of Feb. 14, 2023. Source: MSCI ESG Research
Residential properties' emissions are reported in two scopes:
- Scope 1 emissions stem from the use of oil or natural gas for heating and cooking
- Scope 2 emissions come from electricity consumed in the property2
Higher Scope 1 emissions in Alaska and the Northeast
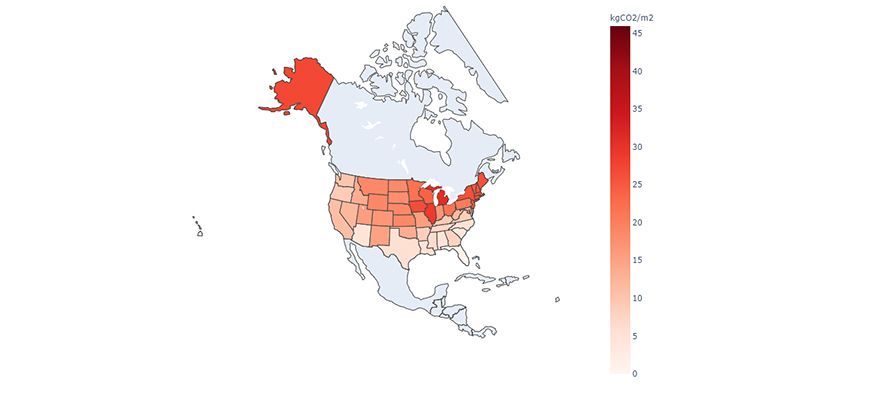
Data as of Feb. 14, 2023. Source: MSCI ESG Research
Scope 2 emissions were higher in the Midwest and South compared to other regions. To understand why, we disaggregated Scope 2 figures (kgCO2e/m2) into grid emission intensity (measured in kgCO2e per kilowatt hour) — i.e., how "dirty" the electricity grid is — and electricity use (kWhr/m2). This disaggregation reveals that the Midwest's relatively high Scope 2 emissions were due to high grid-emission factors (left-hand chart below), while the higher Scope 2 emissions in Southern states were due to relatively high use of electricity per square meter (right-hand chart below).
How Scope 2 emissions and intensity varied by state
Grid emission intensity | Electricity-use efficiency |
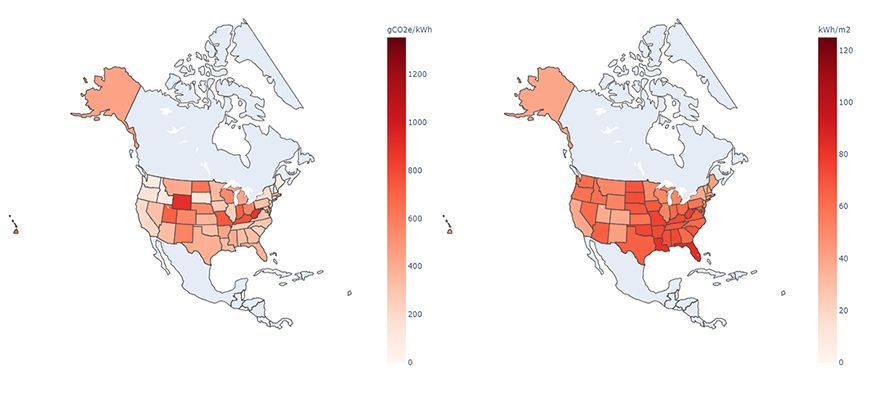
Data as of Feb. 14, 2023. Source MSCI ESG Research
This state-level residential emission data is likely to be of increasing interest to investors as state-level initiatives are introduced over time to try to lower residential emissions.
Further Reading


Subscribe todayto have insights delivered to your inbox.
1Presenting data per square meter means it is independent of property size. These emission factors do not capture emissions from construction.2As laid out by the Greenhouse Gas Protocol.3”Oil-fired boilers and furnaces.”, U.S. Department of Energy, Energy Saver, February 2023.
The content of this page is for informational purposes only and is intended for institutional professionals with the analytical resources and tools necessary to interpret any performance information. Nothing herein is intended to recommend any product, tool or service. For all references to laws, rules or regulations, please note that the information is provided “as is” and does not constitute legal advice or any binding interpretation. Any approach to comply with regulatory or policy initiatives should be discussed with your own legal counsel and/or the relevant competent authority, as needed.