
Constructing Portfolios from Published Equity Research
- In-sample bias and post-publication decay erode the performance of systematic equity strategies built on published signals; they kept only a quarter of their information ratio on average once the paper on them was public.
- Combining signals restored value. Signal selection based on out-of-sample significance, a 12-month trend filter and minimum-variance relative weighting resulted in a signal composite with an information ratio of 1.7.
- In our simulated systematic market-neutral strategy, a constrained daily rebalance retained a gross IR of 1.6, lifted the break-even cost to 6.2 basis points and 14.7x annual turnover.
Mentioned in this blog post:
MSCI SignalLab | MSCI USA Equity Factor Model | MSCI Quantitative Investment Solutions
Cross-sectional equity research asks why some groups of stocks outperform others over the same period. It seeks to identify company characteristics, such as valuation, price momentum or earnings quality, and turns them into potential signals that rank stocks from most to least attractive.
Quantitative equity managers who build portfolios based on such studies face several questions. Have the published signals performed after their discovery date? Has signal performance survived adjusting for style factors? Could the signals be combined into a robust composite that added value over established factors?
The MSCI Risk Premia Signals module, part of SignalLab, is designed to aid portfolio construction and risk management, and help address these questions. The module builds on cross-sectional equity strategies published in the financial research literature and seeks to provide an objective, unbiased view of performance after each article's journal publication date.
We tested 41 distinct daily signals drawn from seven investment categories, with source papers published between July 2000 and October 2013. In contrast to the original monthly definitions used in the journals, we transformed the published signals to daily, which is more suitable for a range of applications. Daily signals fit hedge fund strategies that rebalance daily the most directly, but lower-frequency asset manager and index use cases can also use them to rebalance based on the most recent information available on the market. Each signal was implemented using only data available up to its source paper's publication date, and it enters the out-of-sample record on the first day of the month after publication. To reduce in-sample bias, every idea implemented is retained in the module, regardless of its subsequent performance, making post-publication studies a fairer out-of-sample result.
We studied individual signal performance from January 1995 through May 2026.1 Signal performance, on average, dropped after publication but remained positive.
Cumulative return of risk premia signals, rebased to zero at each signal's publication date. Data from January 1995 to May 2026, MSCI USA IMITM Index.
A published signal was rarely purely idiosyncratic. Most carried loadings on common systematic factors. A useful test is what remains after those exposures are stripped out. We measured every signal and composite with three levels of neutralization: raw,2 market-beta-neutral and eight-factor-neutral, using the MSCI USA Equity Factor Trading Model.3
Neutralization to style factors improved information ratio (IR) by reducing systematic risk in signal performance. The mean post-publication IR across the raw signals rose from 0.17 to 0.28 in the eight-factor-neutral analysis. The effect at the composite signal level was even more pronounced. An equal-weighted basket of every published signal earned a post-publication IR of 0.19 raw, 0.54 beta-neutral and 1.10 eight-factor-neutral. Without neutralization, the selected published signals carried a great deal of uncompensated systematic risk, captured by the MSCI style factors.
The decay was unambiguous in our results, irrespective of the neutralization approach we tested. The mean IR fell from 1.00 before publication to 0.28 after eight-factor neutralization. The pattern held for raw signals (0.36 → 0.17) and beta-neutral (0.51 → 0.23) alike. Roughly seven in ten signals weakened and about one in six turned outright negative, though ten still clear a post-publication IR t-statistic of 2.0.4
The decay pattern was not random. Pre- and post-publication information ratios remained positively related in the eight-factor-neutral space, with a correlation of 0.45. This correlation tells us that what worked before publication tends to keep working, but the majority of signals suffer a sharp post-publication performance decay.
Each point is one signal, plotted by pre-publication IR against post-publication IR, colored by investment theme. Data from January 1995 to May 2026, MSCI USA IMI.
Decaying signals after their publication date may still carry some information but appear to be noisy. Combining signals based on post-publication performance could diversify and create more reliable signals forming a robust composite. Signals are considered eligible only from the first month after their paper appears, so the entire composite history is out-of-sample by construction. We compared composites and portfolios calculated from January 2010, by which time most of the signal set was already past publication, and can provide a meaningful post-publication record and a long enough history from which to estimate performance and the covariance between signal returns. The lower panel in the figure below shows how the post-publication signal set builds up over time to the full set by October 2013.
In the top panel the chart displays the performance of our signal composites in daily return simulations. The simplest approach a manager could follow is probably an equal-weighted average of every post-publication signal. It earned a post-publication IR of 1.1, with a t-statistic of 4.5 and a 2.3% annualized return on gross market value. If only the ten signals with the highest post-publication information-ratio t-statistics were used, then the composite IR rose to 1.2. (We relied on an expanding-window post-publication performance to select the signals with the strongest statistical significance of performing out-of-sample.) Applying a standard positive 12-month trend filter improved signal performance of the top-10 composite to an IR of 1.36.5 Weighting those same selected signals by a long-only minimum-variance allocation among eligible signals reduced weight allocated to correlated signals and resulted in an IR of 1.7.6 Each additional layer of robustness improved performance further in our test.
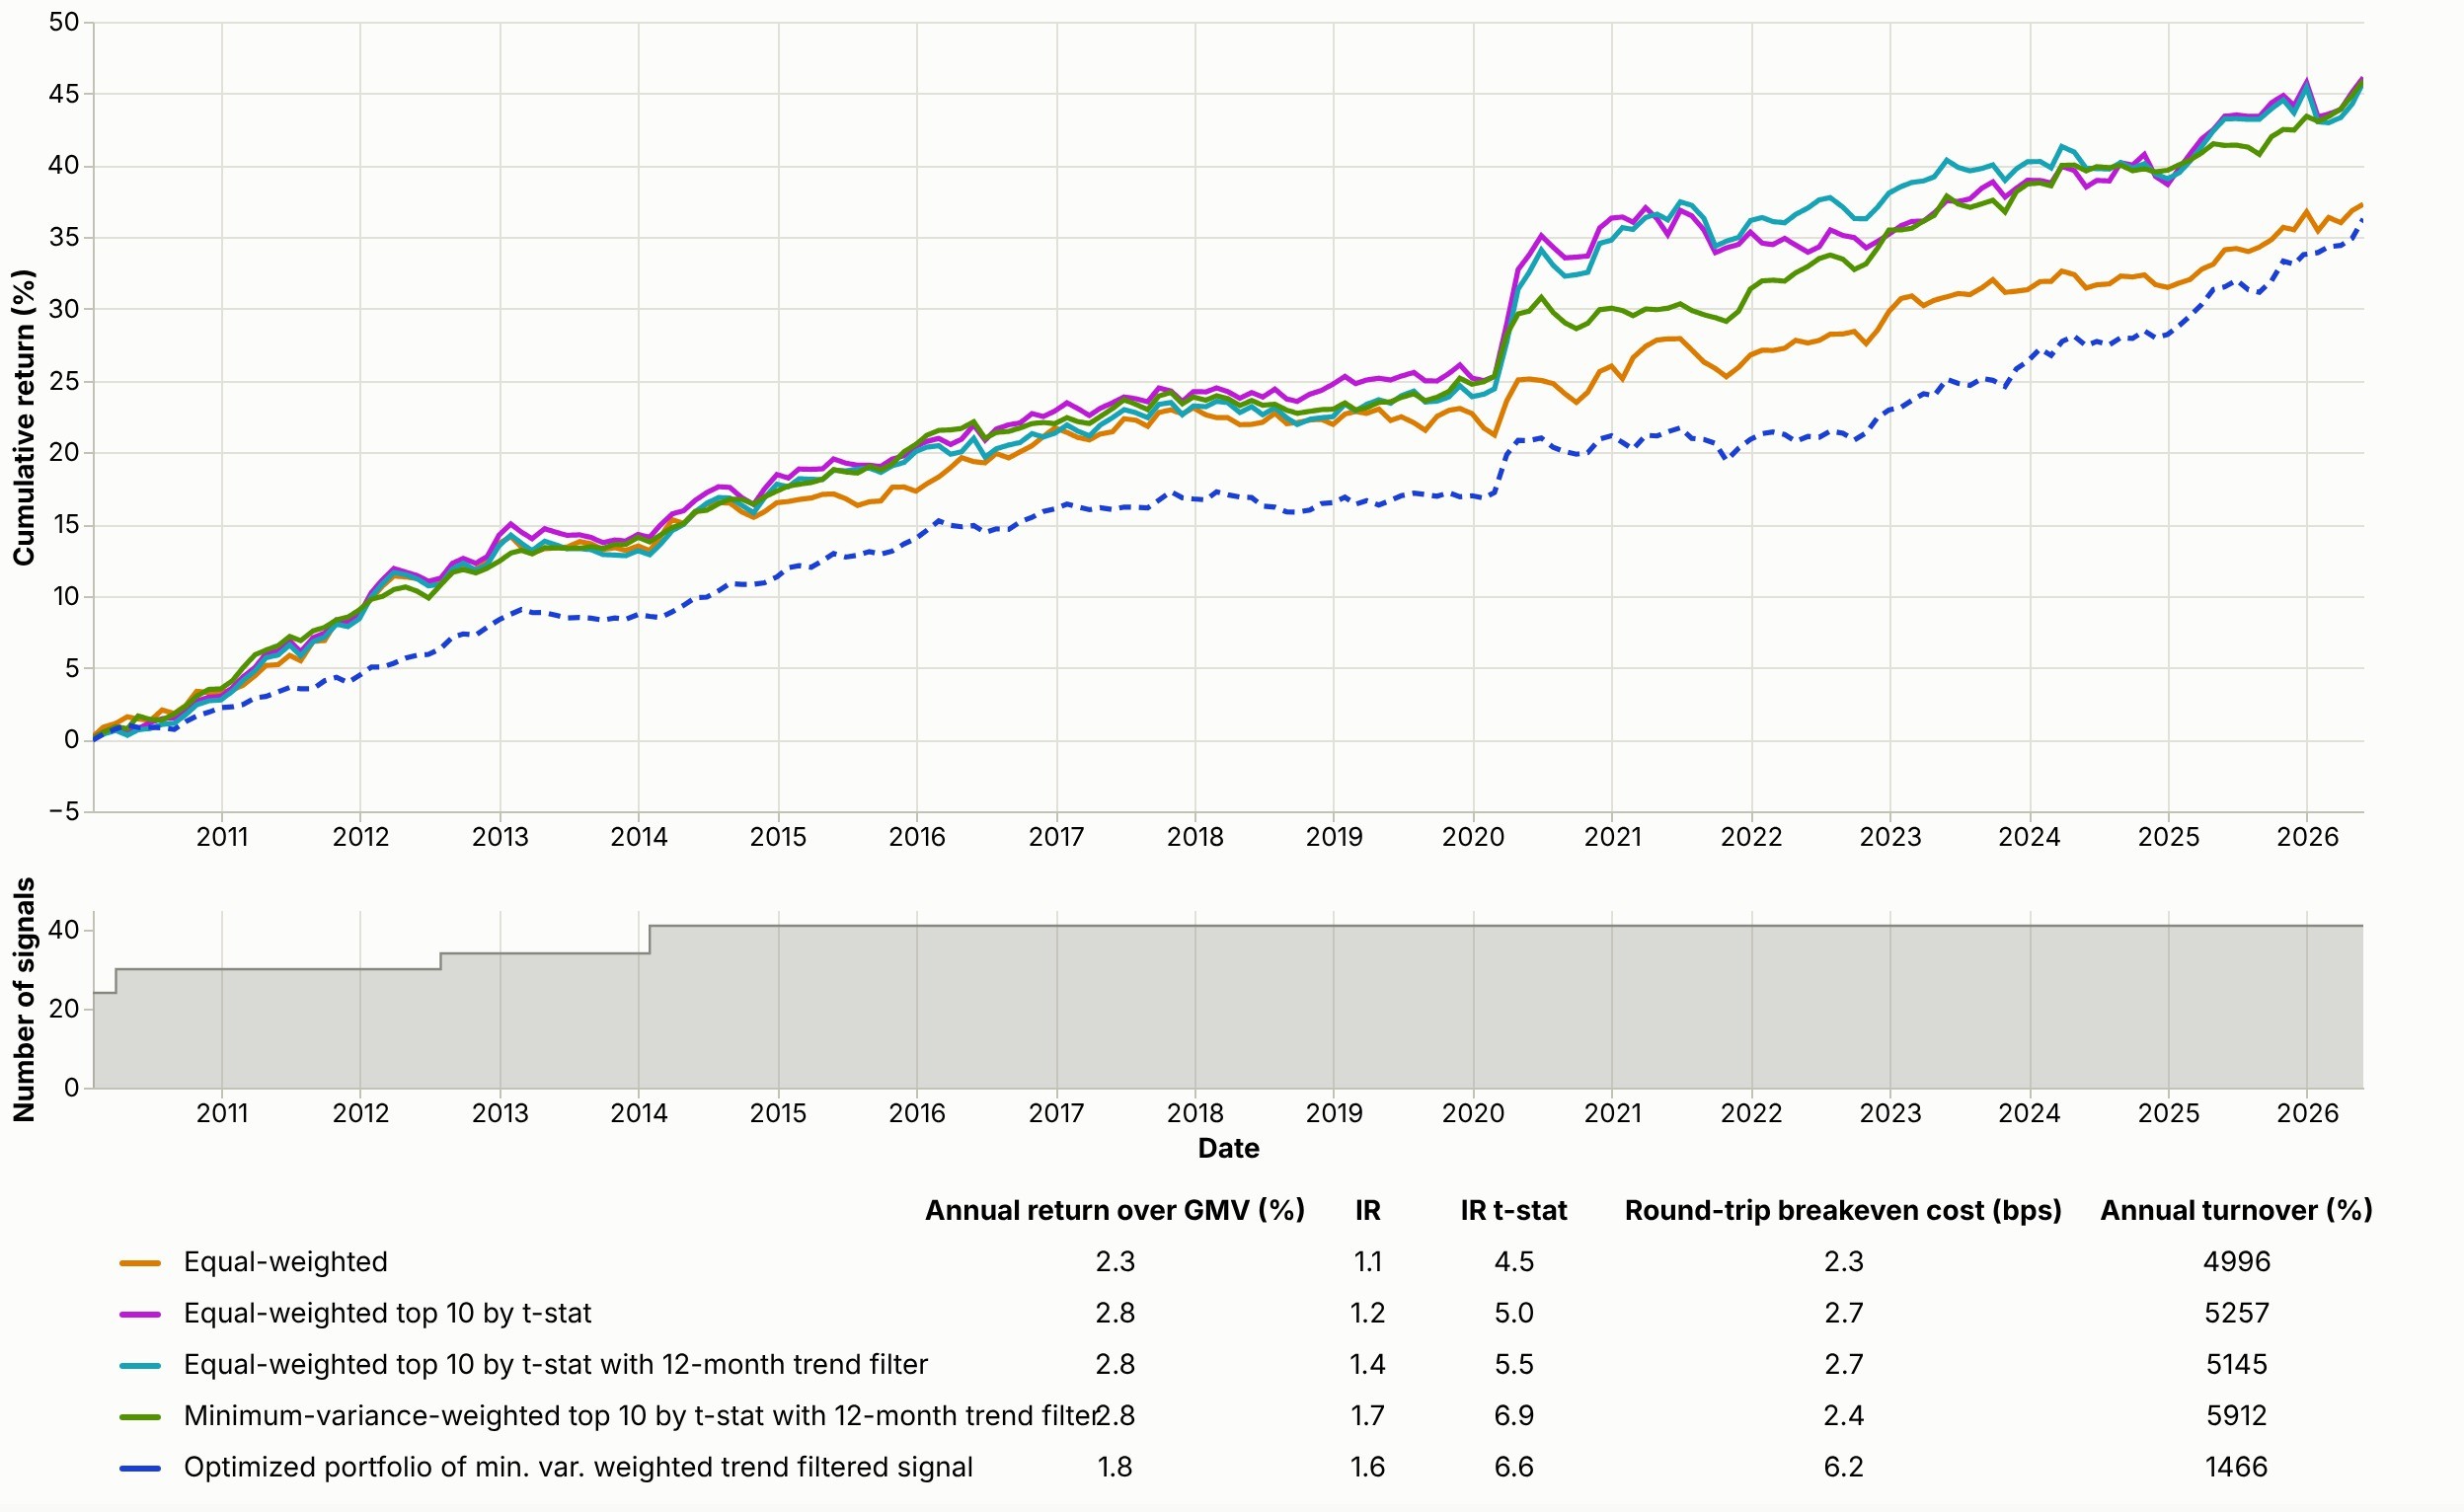
Cumulative return of the point-in-time out-of-sample composites. Data from January 2010 to May 2026, MSCI USA IMI.
Unlock the interactive comparison of raw, beta-neutral and 8-style factor neutral results.
The chart below illustrates the mix of signals selected by each of the composites, aggregated into signal categories. In the last investment period of our backtest, five signals survived the top-10 t-statistic and 12-month trend filter criteria. While the signals belonged to three different signal categories, minimum-variance allocation reduced the weight of those published in the same paper. Three of our signals were based on fundamentals-adjusted ratios, one was based on a put-call implied volatility differential, while the last was based on calendar-month return seasonality7.
Monthly weight share of each constituent signal in the selected composite, colored by investment theme. Data from January 2010 to May 2026, MSCI US Equity IMI.
The final step of the MSCI signal research workflow is portfolio optimization: we construct investable portfolios with limited turnover and a controlled risk profile. Specifically, we studied a 100/100 market-neutral long-short equities strategy, rebalanced daily using the MSCI USA IMI index universe and the MSCI USA Equity Factor Trading Model. We constructed the strategy using the minimum-variance composite of the eligible signals. We also applied 5% Global Industry Classification Standard (GICS®)8 sector exposure limit constraints and a 2.5% factor exposure limit over the portfolio. While the pure composite portfolio had a gross IR of 1.7, its round-trip break-even transaction cost was only 2.4 bps. Applying a 10% daily turnover limit significantly reduced turnover, resulting in a round-trip break-even transaction cost of 6.2 bps while IR only dropped to 1.6.
In practice, implementation choices, including composite construction, rebalance frequency and optimization constraints, depend on a portfolio's investment goal. Our analysis focused on daily rebalancing. However, the same framework is relevant to less frequently traded signal-based strategies used by asset managers and index providers, even if they would need different calibration. Whatever the investment process, the risk premia signals module seeks to supply the building blocks for portfolio managers from signal implementation through transformation to a tradable portfolio.



Subscribe todayto have insights delivered to your inbox.
SignalLab
Access research-grade investment signals across various dimensions of return - all in one place, all standardized and thoroughly validated.
The Common Language of Portfolio Construction
Different investment teams, same underlying math. A unified optimization workflow — built on factor risk models — reveals trade-offs and sharpens outcomes across strategies.
1 All simulations run on the MSCI USA IMITM Index. Signals observed as of the close are lagged by one complete day and held until the next close, to adhere to strict tradability constraints. All figures quoted in this post are signal-weighted returns representing unit exposure invested long and short, proportional to signal exposures.
2 Raw signals are the exact definition of the signal in a given paper without neutralization.
3 Orthogonalization covers the eight style factors with the strongest cross-sectional explanatory power: beta, value, momentum, size, residual volatility, liquidity, earnings yield and profitability.
4 Pre-publication is strictly before the publication month and post-publication strictly after it; the publication month itself belongs to neither window. IR is annualized; the t-statistic is on the mean daily return.
5 We apply a standard positive 12-month trend filter to signal performance, to adapt to the macro environment, as commonly defined in asset allocation research. A signal contributes only while the trailing mean of its own return series is positive.
6 We estimate the minimum-variance combination of signals monthly over an expanding-window covariance matrix with Ledoit-Wolf average-correlation shrinkage, so that no free parameters, such as shrinkage intensity or covariance-window length, are introduced. Full details in Ledoit, O., & Wolf, M. (2004). Honey, I shrunk the sample covariance matrix. The Journal of Portfolio Management.
7 The selected signals are based on the following papers: Jiyoun An and Sanjeev Bhojraj and David T. Ng, "Warranted Multiples and Future Returns", Journal of Accounting, Auditing & Finance 25, no. 2 (2010): 143–69; Shu Yan, "Jump Risk, Stock Returns, and Slope of Implied Volatility Smile", Journal of Financial Economics 99, no. 1 (2011): 216–33; and Steven L. Heston and Ronnie Sadka, "Seasonality in the Cross-Section of Stock Returns", Journal of Financial Economics 87, no. 2 (2008): 418–45.
8 GICS is the industry-classification standard jointly developed by MSCI and S&P Dow Jones Indices.
The content of this page is for informational purposes only and is intended for institutional professionals with the analytical resources and tools necessary to interpret any performance information. Nothing herein is intended to recommend any product, tool or service. For all references to laws, rules or regulations, please note that the information is provided “as is” and does not constitute legal advice or any binding interpretation. Any approach to comply with regulatory or policy initiatives should be discussed with your own legal counsel and/or the relevant competent authority, as needed.