Corporate Asia’s Energy Transition: Policy, Technology, Readiness
- A systematic approach focusing on policy, technology and readiness can help investors assess companies’ transition risks and opportunities with greater clarity.
- Applying the MSCI Energy Transition Framework, we find that differing policy impetus and maturity of decarbonization technologies across regions and sectors can create risk divergences among APAC companies.
- Readiness to navigate risks in an uneven energy transition may become a key differentiator. APAC firms show strengths in oversight, risk management and clean-tech exposure but have room to improve in climate integration.
The Asia-Pacific (APAC) region accounted for over half of global energy-related carbon dioxide emissions in 2023 and yet is home to some of the fastest growing clean-tech companies, leaving it well placed to potentially play a pivotal role in the global energy transition. For investors, systematically integrating financially material transition factors may help optimize risk-adjusted returns. Drawing on the MSCI Energy Transition Framework (the “Framework”), we assessed APAC companies through three key lenses: policy, technology and readiness.
Policy and regulations are critical dependencies and enablers of private climate investment.1 Across APAC, most major emitting countries have adopted long-term national carbon-neutrality targets.2 Carbon-pricing mechanisms are being rolled out, though existing fossil-fuel subsidies could dilute intended price signals.3 As the regional policy landscape matures, implementation — including embedding climate targets in legislation — will be the key test of credibility.
These dynamics are reflected in the policy pressure component of the Framework, which gauges the degree of policy-driven financial pressure on companies to decarbonize. We found notable differences across APAC markets: companies in South Korea, Australia, New Zealand and Japan face the highest pressure, due to the presence of carbon pricing, reduced fossil-fuel subsidies and ambitious national climate targets. In contrast, companies in India and emerging ASEAN face comparatively lower pressure.
Our prior research shows that higher policy pressure has been associated with greater reductions in corporate emissions intensity in recent years, after controlling for voluntary targets and industry-specific factors. This relationship differs by region, however. It tends to be stronger where climate policy frameworks are more institutionalized. Robust and credible policies may therefore be essential to accelerating corporate decarbonization efforts in APAC.

Data as of Oct. 16, 2025. Analysis based on constituents of the MSCI ACWI Investible Market Index (IMI) in the APAC region as of June 30, 2025. Each bar reflects the average policy pressure score of companies in a market, weighted by emissions. The score, ranging from 0 (low pressure) to 10 (high pressure), reflects transition risks linked to regulatory and policy environments across companies’ operational or revenue footprints. It captures the strength of government and market mechanisms (e.g., carbon pricing and fossil-fuel subsidies) as well as near- and long-term ambitions. Market classification is based on the MSCI Market Classification Framework. For details, refer to MSCI Energy Transition Framework methodology. Source: MSCI Sustainability & Climate. MSCI Sustainability & Climate products and services are provided by MSCI Solutions LLC in the United States and MSCI Solutions (UK) Limited in the United Kingdom and certain other related entities.
The feasibility of decarbonization depends heavily on the maturity of available technologies. The technology pressure component of the Framework evaluates companies’ exposure to technology obsolescence risks, considering factors such as cost parity, abatement potential and implementation challenges.
In sectors like power generation and auto manufacturing, alternative technologies are already scaling rapidly.4 The rise of renewable energy and electric vehicles in China illustrates how swiftly transition can unfold when policy support aligns with technology and market readiness.5 For incumbents in these sectors, and those in their value chains, delaying transition could present both strategic and financial risks.
By contrast, heavy industries such as steel, construction materials and petrochemicals — where APAC companies are major producers — face more complex and costly transition pathways.6 Examples include hydrogen-based steelmaking, carbon-capture-equipped cement plants and electrification of refinery processes. As a result, heavy industries in APAC may face lower near-term technology obsolescence risks than faster-evolving sectors. Still, advances in breakthrough technologies in industries such as steel could narrow this gap and lower adoption barriers over time.

Data as of Oct. 16, 2025. Analysis based on constituents of the MSCI ACWI IMI in the APAC region as of June 30, 2025. Source: MSCI Sustainability & Climate
Understanding risk drivers is only part of the story. Equally important is assessing if companies are ready to adapt — to sudden policy or technological shifts, or to gradual shifts that erode profitability over time.
The transition readiness component of the Framework reveals varying levels of company preparedness across APAC markets. One key indicator is how deeply climate transition considerations are embedded in corporate governance and risk management. Companies in New Zealand, Singapore and Taiwan lead regionally, with most having established board- and management-level oversight mechanisms. Such structures are less common among firms in India and Indonesia, and overall more prevalent among larger firms. This is likely due to disclosure regulations focusing on large, listed entities.7
Executive compensation is another signal of readiness. Companies in Japan and New Zealand were more likely to link pay to disclosed climate metrics, reflecting regulatory disclosure obligations and stronger expectations from institutional investors.8
Disclosures on climate strategy offer another view. South Korean and Japanese firms showed the highest transparency across key metrics such as exposure to transition risks, implementation of internal carbon pricing and low-carbon capital expenditure. Yet, disclosure on compensation alignment and strategy remains limited both in APAC and globally, suggesting that climate integration is still maturing.
Data as of Oct. 16, 2025. Analysis based on constituents of the MSCI ACWI IMI in the APAC region as of June 30, 2025. Each bar represents the average scores for companies classified in an APAC market. The following governance & strategy components of the MSCI Energy Transition Framework are shown on the chart: i) Board; ii) Risk management; iii) Pay; iv) Strategy; and v) CapEx. Each component is assessed on a 0 to 10 scale, with 10 indicating that companies have shown strong evidence of disclosure based on the scoring rubrics defined in the MSCI Energy Transition Framework methodology. Source: MSCI Sustainability & Climate
Despite trailing global peers on readiness metrics, APAC companies currently account for a large share of estimated revenues from key transition solutions, including solar power, energy efficiency and flexibility solutions, and clean transport. Chinese, Japanese and South Korean firms are both regional and global leaders, underscoring their pivotal role as providers of climate solutions.
Technology readiness also matters in understanding competitive positioning. APAC companies involved in technologies already scaling commercially, such as solar and wind power, electric vehicles and energy storage, may be better positioned for growth, provided that associated risks are effectively managed.9
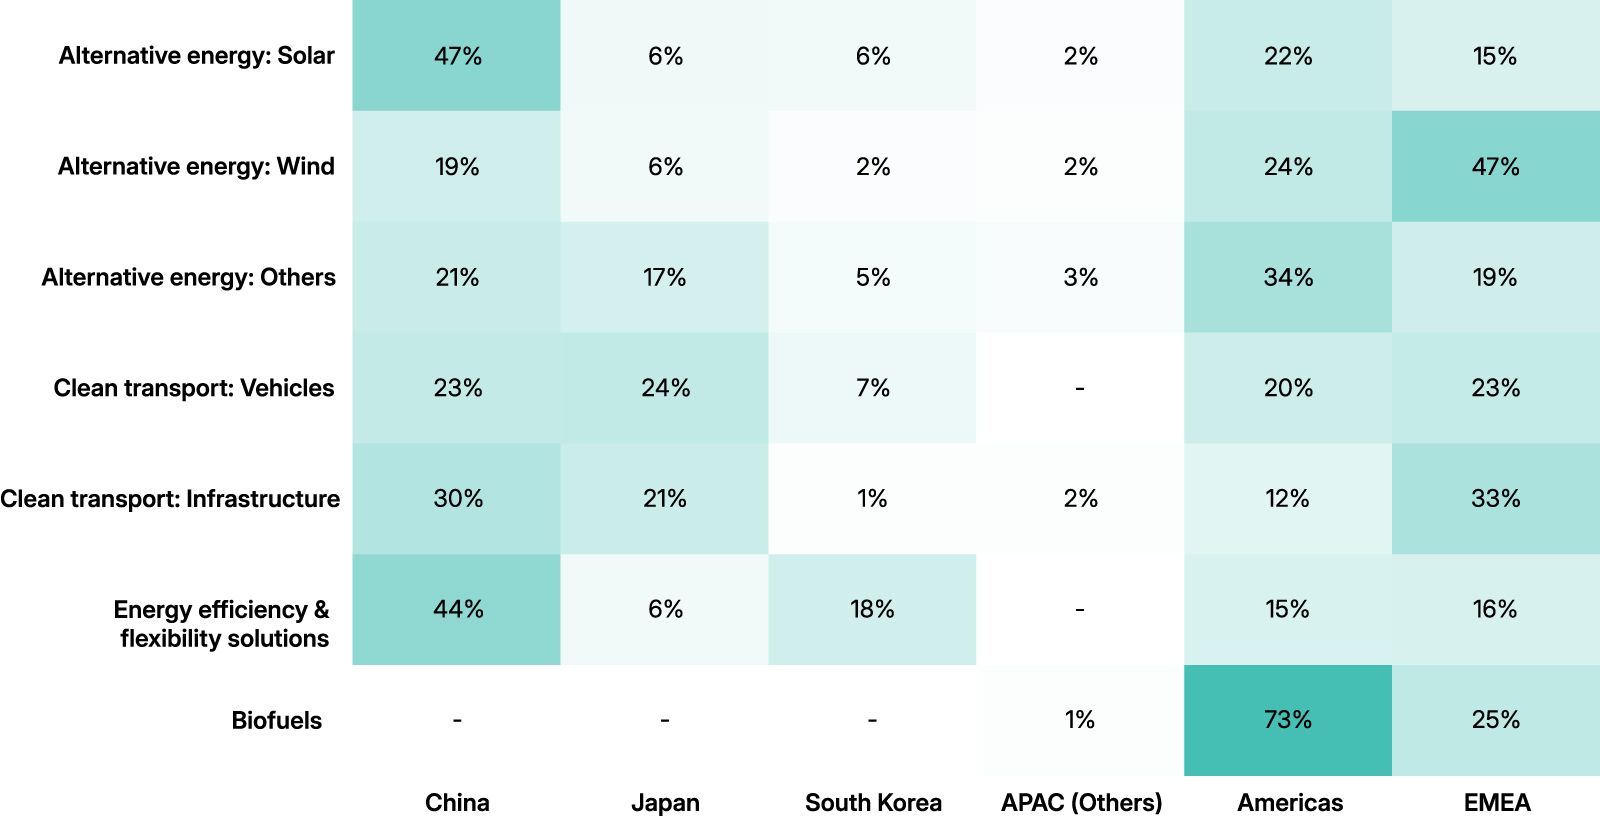
Data as of Oct. 16, 2025. Analysis is based on the latest reported revenue of 1,463 constituents of the MSCI ACWI IMI (as of June 30, 2025) that were assessed to have derived revenue from clean-tech solutions. Clean-tech categories follow definitions from the MSCI Sustainable Impact Metrics and Business Involvement Screening Research methodologies. Alternative energy includes power generators and equipment providers. Alternative energy in the “others” category includes nuclear, geothermal, waste-to-energy, biomass, gas co-generation, small hydropower and fuel cells. Energy efficiency and flexibility solutions include energy storage, demand-side management and grid solutions. Clean-transport infrastructure includes urban mass transit, electric-vehicle charging and other sustainable transport solutions. Clean transport vehicles include hybrid and battery-electric vehicles. Only values above 1% are shown in the chart. Source: MSCI Sustainability & Climate
APAC companies face differing levels of transition risk and show varying levels of preparedness. The energy transition is likely to unfold unevenly across markets and sectors, shaped by varying policy and technology dynamics. Companies’ ability to adapt to these dynamics and execute strategies effectively will help determine future leaders and laggards. Assessing these key factors through a structured approach can help investors gain sharper insights into which companies are best positioned to navigate and benefit from the transition.

Subscribe todayto have insights delivered to your inbox.
Setting Expectations Amid a Bumpy Energy Transition
Using MSCI’s Energy Transition Framework, we examine how technological, financial and policy factors drive corporate decarbonization — and what that means for investors assessing transition risk.
Materiality-Weighted Portfolio Carbon Footprint
We found that, over the past decade, emissions-based transition risk had a stronger relationship with corporate earnings, stock performance and credit risk than previous academic studies suggested.
1 “Asia-Pacific Climate Report 2024: Catalyzing Finance and Policy Solutions,” Asian Development Bank, October 2024.
2 “2024 Review of Climate Ambition in Asia and the Pacific,” UN ESCAP, 2024.
3 “Carbon Taxes and Fossil Fuel Subsidies – The Governance Brief,” Asian Development Bank, Issue 58, December 2024.
4 Sectors are defined according to the Global Industry Classification Standard (GICS®). GICS is the industry-classification standard jointly developed by MSCI and S&P Dow Jones Indices.
5 “China Energy Transition Review 2025,” Ember, September 2025.
6 According to data from the World Steel Association and United States Geological Survey, the APAC region accounted for 72% of global crude steel production and 68% of global cement production respectively in 2023. China accounted for more than half of the global production of both materials.
7 “Adoption of IFRS Sustainability Disclosure Standards by jurisdiction,” Deloitte, Aug. 27, 2025.
8 “Incentivising Climate Action with Executive Remuneration in Australia,” Investor Group on Climate Change, November 2024.
9 “China warns EV makers to stop price-cutting to protect the economy,” The Guardian, Aug. 5, 2025.
The content of this page is for informational purposes only and is intended for institutional professionals with the analytical resources and tools necessary to interpret any performance information. Nothing herein is intended to recommend any product, tool or service. For all references to laws, rules or regulations, please note that the information is provided “as is” and does not constitute legal advice or any binding interpretation. Any approach to comply with regulatory or policy initiatives should be discussed with your own legal counsel and/or the relevant competent authority, as needed.