Crowd Control, Momentum and Concentrated Markets
Key findings
- Equity investors seeking to manage their portfolio risk in concentrated, sentiment-driven markets could use quantitative tools to help identify where the greater risk of de-rating lives.
- We show how the integrated crowding score can be used to build insight, leveraging its relationship with time-series valuations.
- We translate this signal information into portfolio construction by showing how a simple constraint based on the time-series crowding score has improved the risk/return characteristics of a momentum-based strategy.
Global equity markets remain highly concentrated, creating headwinds for active managers to express their best ideas and manage portfolio risk. Using the MSCI Security Crowding Model and the related factor built into the MSCI Global Equity Factor Trading Model, we demonstrate how portfolio managers can better identify the securities potentially most vulnerable to future de-rating.
Additionally, we show how to translate these pure factor perspectives into a practical portfolio-construction technique. This approach could be particularly relevant to strategies with a strong sentiment exposure.
Identifying stocks vulnerable to de-rating
Stocks with a high MSCI integrated crowding score can be thought of as representing a "happy hunting ground" for companies vulnerable to de-rating. These stocks tend to be more expensive, riskier and highly traded, with sentiment and multiples that have increased sharply relative to their own history as well as to the market.[1]
The associated crowding factor focuses on the time-series aspect to better fit into an equity risk model. Any such clash is further reduced by neutralizing it against familiar standard factors — in practice, it is the momentum exposures that are largely removed. Therefore, stocks flagged by the crowding score, and which also score highly on the crowding factor, could be sold from a portfolio without fighting against the momentum factor. Indeed, the portfolio could benefit from the factor return earned from the reversion of stock valuations.
This last point is borne out by our findings that show the crowding factor has steadily generated negative returns for MSCI ACWI Investable Market Index (IMI) constituents since 1997 (this result is resilient to changes in region[2]). Decile portfolios show a near-monotonic relationship between a higher crowding factor and negative excess return.
Higher crowding factor exposures are associated with negative returns

Data from January 1997 to October 2024. Annualized decile returns are calculated using monthly excess returns. Decile portfolios are square-root cap-weighted.
This relatively slow-moving signal has had predictive power not only in the next month, but also, materially, in the second and third months.[3] Stock-specific residual volatility follows an analogous trend over these horizons.
Crowding factor has had a predictive power over a three-month horizon

Data from January 1997 to October 2024. Annualized decile returns are calculated using monthly excess returns. Decile portfolios are square-root cap-weighted. Decile spread is the difference in return of the top- and bottom-decile portfolios.
Integrating crowding scores into portfolio construction
Purely in factor terms, the difference between the information in the score and the factor-model exposure can be seen in the quintile return spreads, especially in the dot-com bubble's bursting, the 2008 global financial crisis and the COVID-19 pandemic.
Historically, the crowding score has been more volatile than the crowding factor

Data from January 1997 to October 2024. Quintile portfolios are square-root cap-weighted.
Since the realized crowding score correlates with its input components, its long-short return spread reflects all of their influences, especially, momentum's. In contrast, the key influence on the model factor's return is the mean reversion of stock valuations.
Correlation of crowding score with select equity factors

Data from January 1997 to October 2024. Average monthly cross-sectional correlations of integrated crowding score with select model factors for constituents of the MSCI ACWI IMI.
How might a portfolio manager directly control the aggregate "de-rating risk" in their portfolios? We begin by looking at the underlying signals. With time-series value as the key driver of the crowding factor's strong returns, and given value and momentum's well-known historical relationship,[4] we would expect to see an improvement in the behavior of the momentum factor when it is combined with information from a crowding score.
We established this by adding a crowding score in a customization of our long-term factor models and observed how momentum's behavior shifted across time and regions.[5]
Time-series crowding-score signals improved behavior of momentum factor

Data from January 1997 to October 2024. Monthly factor return to momentum in MSCI Equity Factor Models (Long Term) as base case, then augmented with the time-series crowding score and the time-series valuation score.
A two-factor alpha is not needed to consistently incorporate this finding in portfolio construction. Instead, we can use a simple constraint based on the crowding score. We constructed a monthly rebalancing strategy that maximizes, at the portfolio level, the momentum exposure with a predicted tracking-error limit of 3% and a time-series crowding score below that of the market.[6] In the long run, this simple time-series approach using a crowding-score-based constraint has produced favorable risk/return outcomes because it helps ensure that stock selection within high-momentum quintiles avoids overbought stocks.
A simple crowding-score constraint improved risk/return outcomes

Data from January 1999 to October 2024. The monthly "simple" momentum strategy maximizes, at the portfolio level, the momentum exposure with a predicted tracking-error limit of 3% and is "enhanced" by a constraint on the time-series crowding score to be below that of the market.
The score constraint applied to high-momentum scores also enforces a strong average underweight of the crowding factor (active -0.5 standard deviation for this period and universe) because of the neutralization. The neutralization prevents the equivalent factor-based constraint delivering the same control.
A simple constraint on crowding score forces a strong control on the crowding factor
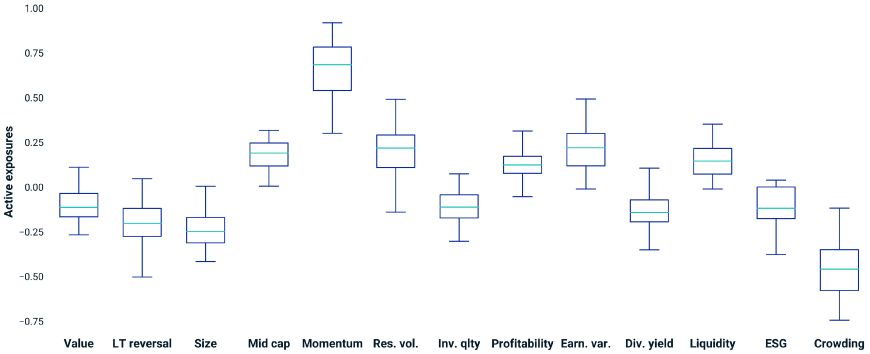
Data from January 1999 to October 2024. Active factor exposures are monthly averages using the EFMGEMTR model. We show factors with absolute median active exposure over 0.1 standard deviation.
The crowding score and a control on momentum
In concentrated markets, investors can become wary of portfolios dominated by sentiment factors. We have shown how the crowding score can help investors identify securities most at risk of de-rating. Uncrowded, high-momentum stocks have performed well, while crowded, lower-momentum stocks have been vulnerable to price correction. We also translated these insights into a simple constraint that has historically improved momentum-based strategies, leveraging the well-known value/momentum interaction.


Subscribe todayto have insights delivered to your inbox.
1 Formally, the score measures stocks based on their valuation (price-to-earnings and/or price-to-book ratios), short interest, momentum, liquidity and residual volatility relative to other stocks (cross-sectional) and relative to their own history (time-series). Exact weights are in the MSCI Security Crowding Model Factsheet, Realized loadings align with the model.2 The information ratio (IR) globally is -1.5 between January 1997 and October 2024: the third-strongest risk-adjusted monthly return among the styles in the MSCI Global Equity Factor Trading Model. Across regions, the IR varies between -0.8 to -1.5 (an annualized factor return of -0.9% to -1.2% per year over the same period.)3 The average monthly cross-sectional serial correlation of the exposure is 0.87 in the MSCI Global Equity Factor Trading Model between January 1997 and October 2024.4 See, for example, Clifford Asness, Tobias Moskowitz and Lasse Pedersen, “Value and Momentum Everywhere,” Journal of Finance 68, no. 3, 2013, and Clifford Asness, “Momentum in Japan: The Exception that Proves the Rule,” Journal of Portfolio Management 31, no. 4, 2011.5 We ran monthly cross-sectional factor-return regressions between January 1997 and October 2024 with the latest MSCI Equity Factor Models (Long Term) for a given region, as the base case.6 We can consider this a proxy for any sentiment-driven investment strategy. In the simulation, we limited annual turnover to 100% and active positions to less than 50 times benchmark weight. Active factor exposures are monthly averages using the EFMGEMTR model. We show factors with absolute median active exposure over 0.1 standard deviation.
The content of this page is for informational purposes only and is intended for institutional professionals with the analytical resources and tools necessary to interpret any performance information. Nothing herein is intended to recommend any product, tool or service. For all references to laws, rules or regulations, please note that the information is provided “as is” and does not constitute legal advice or any binding interpretation. Any approach to comply with regulatory or policy initiatives should be discussed with your own legal counsel and/or the relevant competent authority, as needed.