Different, Not Diverging: Aligning Temperature-Alignment Metrics
Key findings
- Institutional investors with climate objectives may rely on temperature-alignment metrics to set goals and track progress over time. A critical question for those investors is how comparable these metrics are.
- We compared two such metrics — the MSCI Implied Temperature Rise (ITR) and the Science Based Targets initiative’s (SBTi) — and found a strong correlation when we adjusted ITR to reflect similar parameters as SBTi.
- The correlation decreased when we included all specific features of ITR, including adjustments to projected- and realized-emissions performance, suggesting different metrics answer different questions and may complement each other.
In recent years, many temperature-alignment methodologies have emerged to help investors assess portfolio companies through the goals of the Paris Agreement. At their core, these methodologies aim to extrapolate the projected emissions of a given company into a global temperature-alignment assessment (e.g., 1.5 degrees C) through benchmarking such performance against a science-based decarbonization pathway. The various alignment metrics, however, exhibit a low correlation across their respective assessments (e.g., a 1.5 degrees C company for one methodology may be a 3 degrees C company for another),[1] raising a key question for investors: Does this difference diminish their usefulness?
Let's not compare apples with oranges. Different methodologies have different objectives (e.g. ambition vs. actual performance) and involve different design judgements (e.g., emissions scopes covered), some of which are more science-based than others.[2] While there are a number of methodologies for investors to choose from, the expert working group of the Glasgow Financial Alliance for Net-Zero (GFANZ) has set out recommended best-practices for such methodologies and is often seen as a benchmark for quality.[3] MSCI Implied Temperature Rise (ITR) is broadly in line with these recommendations.
To examine the question of comparability and usability, we investigated the temperature-alignment methodologies for approving near-term company science-based targets by the Science Based Targets initiative (SBTi) alongside the MSCI ITR methodology to gauge temperature alignment.[4]
Comparing apples with apples
We examined a peer set of 508 constituents of the MSCI World Index that had received a temperature-alignment metric from the SBTi for near-term science-based target validation on Scopes 1 and 2 emissions, and through our own methodology.[5] For correlation analysis purposes, we assumed the SBTi near-term alignment classification of "1.5 degrees C" and "well-below 2 degrees C" correspond, respectively, to our metric's temperature bands of "1.5 degrees C aligned" and "2 degrees C aligned."[6] To be able to compare the two metrics in a like-for-like (apples-to-apples) fashion, we adjusted the MSCI ITR by removing some features: we used only Scopes 1 and 2 emissions (instead of all three scopes); limited the evaluation horizon to the near-term (typically around 2030, instead of 2050) and reduced the breadth of the assessment of decarbonization ambitions by removing our emissions-projection adjustment and the tracking of realized emissions against a company-level carbon budget.[7]
As shown in the exhibit below, there was a nearly 70% degree of correlation of temperature ranges between the like-for-like version of MSCI ITR and SBTi temperature-alignment methodologies, which is quite high.[8]
Correlation of company-level temperature alignments for strictly correlated companies
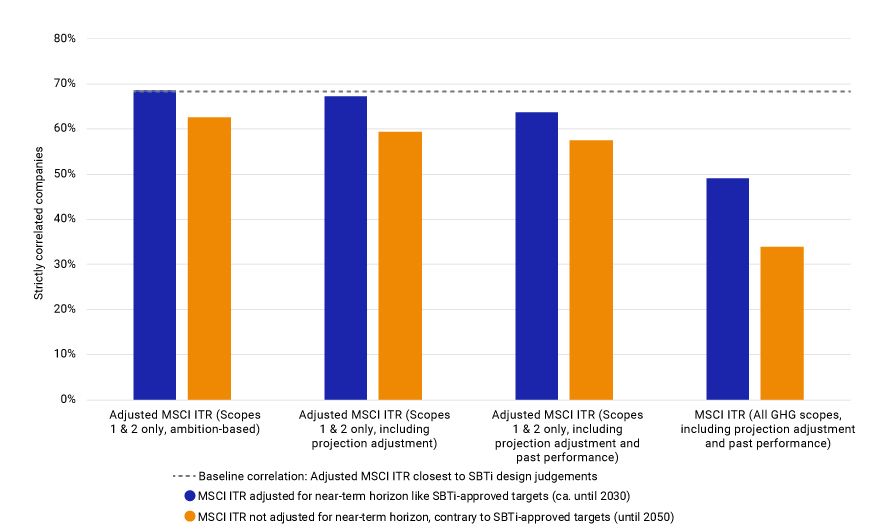
Numbers based on a peer set of 508 constituents of the MSCI World Index that had received a temperature-alignment metric from both the SBTi and MSCI ITR methodologies. Source: MSCI ESG Research, as of May 2024.
The correlation between the two metrics decreased as we added the removed features of the MSCI ITR methodology back in, and was at its lowest when all features were returned including e.g., adjusting target-based projected company emissions.[9]
Comparing the outputs of the two approaches highlights that they have different objectives. SBTi methodologies aim to capture short-term, ambition-based alignment on Scopes 1 and 2; MSCI's ITR aims to include all company emissions projected over a longer horizon, increasing these where stated ambitions are not supported by projection-adjustment indicators, while also tracking the past emissions performance of companies since 2020. The measurements are different, not diverging.
Reaching the Paris (Agreement) Consensus
As mentioned above, when comparing metrics on a like-for like basis, we saw agreement in almost 70% of cases. But what about the other 30% — do the different metrics give wildly different results here? In theory, those temperature-alignment assessments could be made of companies whose MSCI ITR is much higher than 2 degrees C,[10] i.e., much higher than the upper temperature bound of SBTi methodologies. This would signal a notable divergence. But the fact is, the like-for-like correlation increased to nearly 90% when we introduced a "Paris-aligned" correlation between the SBTi and MSCI-based metrics (i.e., considering a 1.5 degrees C-aligned assessment correlates with a 2 degrees C-aligned assessment, and vice versa).
Put simply, SBTi and (like-for-like) MSCI ITR methodologies largely agree on what a Paris-aligned company ambition looks like.
Correlation of company-level temperature alignments for loosely correlated companies
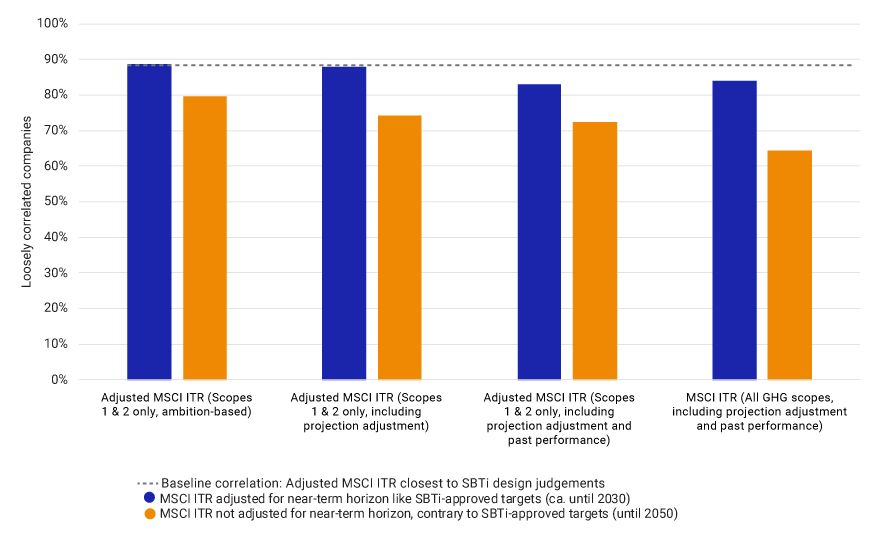
Numbers based on a peer set of 508 constituents of the MSCI World Index that had received a temperature-alignment metric from both the SBTi and MSCI ITR methodologies. Source: MSCI ESG Research, as of May 2024.
In both correlation analyses, the effect of the longer time horizon on the MSCI metric was particularly pronounced, more so driven by the carbon-intensive sectors — e.g., consumer discretionary, industrials and materials. The carbon emissions accumulated over time, if companies did not set strong long-term targets, led to much higher temperature assessments for those companies.
If you can't stand the temperature, get out of the kitchen
As the forthcoming SBTi standard for financial institutions opens up to the use of non-SBTi temperature-alignment methodologies, it becomes more important for investors to understand the different designs and use cases of those methodologies.[11] Our analysis provides evidence for both the comparability and differentiated objectives of well-designed temperature-alignment methodologies. Some investors might prefer a clear focus on gauging companies' ambition to decrease easily measurable emissions, others might appreciate the extra details of a more complex thermometer, such as Scope 3 and actual performance — different temperatures for different goals.


Subscribe todayto have insights delivered to your inbox.
1 See e.g., “The Alignment Cookbook,” Institut Louis Bachelier, 2020.2 “Measuring Portfolio Alignment: Technical Considerations,” Portfolio Alignment Team, October 2021.3 “Measuring Portfolio Alignment,” GFANZ, November 2022.4 See p. 51 of “Implied Temperature Rise Methodology,” MSCI Research, February 2024.5 The MSCI World Index captures large and mid-cap representation across 23 developed markets. We chose this index as the analysis universe as the majority of SBTi-approved targets have taken place in developed markets so far. The constituents of the MSCI World Index are as of May 22, 2024. We focus on SBTi's alignment metrics in this analysis to compare against our own, not only for the SBTi's framework being widely accepted but also for the public availability of SBTi's company-level assessment data.6 We use the term “correlation” throughout this article as shorthand for the percentage of matching temperature-alignment categorization of companies across two methodologies. This is distinct from strictly defined correlation analysis in statistical terms.7 See “Implied Temperature Rise Methodology,” MSCI Research, February 2024 for more details on how the MSCI ITR uses these metrics. The emissions projections (or “target credibility”) adjustment includes indicators on near-term interim targets, third-party verification of targets, track record in meeting past targets and trajectory alignment to meet current targets.8 By contrast, recent research on six temperature alignment metrics finds that the highest pairwise correlation is around 30%. Refer to: Lea Chmel, Manuel C. Kathan and Sebastian Utz, “Are Implied Temperature Rise Metrics as Inconsistent as ESG Ratings? Examining Firm-Level Disagreement Among Data Providers,” Universität Augsburg Working Paper, 2023.9 Adjusting target-based projected company emissions is recommended as best practice by GFANZ, who refer to it as a “target credibility” assessment.10 MSCI ITR assessments range from 1.3°C to 10°C, and most companies in the MSCI World Index are above 2°C (data as of May 2024).11 “The SBTi Financial Institutions Net-Zero Standard – Conceptual framework and initial criteria,” SBTi, June 2023.
The content of this page is for informational purposes only and is intended for institutional professionals with the analytical resources and tools necessary to interpret any performance information. Nothing herein is intended to recommend any product, tool or service. For all references to laws, rules or regulations, please note that the information is provided “as is” and does not constitute legal advice or any binding interpretation. Any approach to comply with regulatory or policy initiatives should be discussed with your own legal counsel and/or the relevant competent authority, as needed.