Equity-Factor Commentary: A ‘Magnificent 7’ Factor?
Key findings
- Market concentration has reached historically high levels in the U.S. We explored how equity factor models have performed in that environment and whether they should include a Magnificent 7 factor.
- We found that MSCI factor risk models maintained their risk-forecast accuracy in 2023, even for portfolios with high concentrations in mega-cap stocks.
- Although a large active weight in the Magnificent 7 stocks was a big contributor to portfolio performance, adding a Magnificent 7 factor did not materially improve the factor model’s risk-forecast accuracy.
In 2023, the weight of the seven largest stocks in the MSCI USA Investable Market Index (IMI) reached 23%, its highest value in decades. In previous blog posts, we wrote about insights from past concentrated rallies, outsized return contributions and potential crowding in a small number of U.S. stocks. Here, we discuss our tests of the forecasting accuracy of equity risk models in an environment of elevated market concentration. Our findings have implications for systematic and discretionary portfolio construction. We also examine if adding a Magnificent-7-stock factor would have affected a risk model's accuracy, in this case, the MSCI USA Equity Factor Trading Model (EFMUSATR).
One key measure of a risk model's performance is the fraction of the variability of the cross-section of stock returns that can be explained by its systematic factors, which include market, style, industry and country. In 2023, far from experiencing a decline, the EFMUSATR's explanatory power (measured by its R2) rose, almost reaching the apex of its 25+ year history.
EFMUSATR's explanatory power was high in 2023
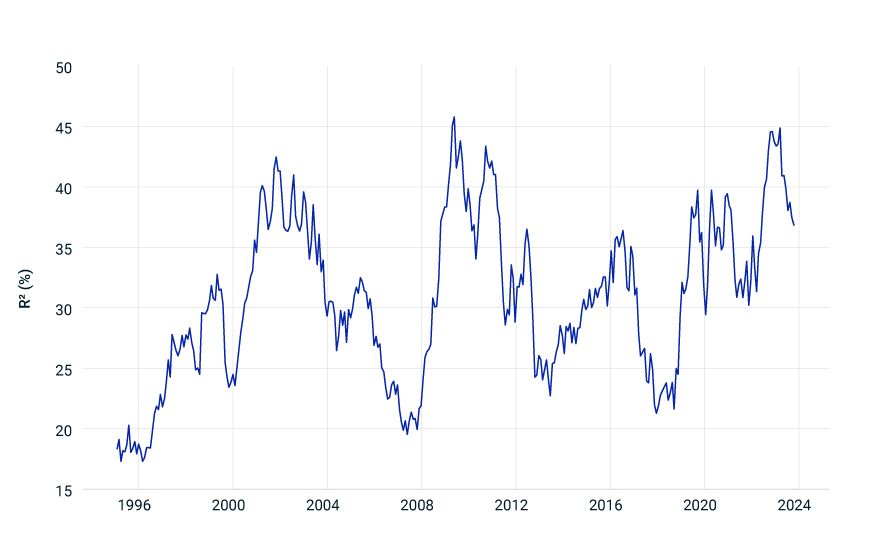
Data period is from January 1995 through October 2023. EFMUSATR is the MSCI USA Equity Factor Trading Model.
Whereas the Magnificent 7 stocks have strongly influenced equity-market returns, their effect on the MSCI factor risk models has been mild and stable. MSCI equity risk models, such as the EFMUSATR, use an approach that limits the impact of a few large companies. The model's methodology assigns weights to stocks based on the square root of a firm's market capitalization. This provision ensures that although large firms may have a greater impact on outcomes than smaller firms, their impact does not dominate. The model offers further balance by capping the weights of the largest stocks at the 99th percentile. The result is that the top 25 stocks[1] (as of today) will all receive the same weight, equivalent to the market cap of the 25th largest stock in the MSCI USA IMI universe.
We illustrate how this works by comparing the market weight and model weight for the seven largest stocks in the MSCI USA IMI universe.
Influence of mega caps on MSCI factor-model estimation has been mild and stable
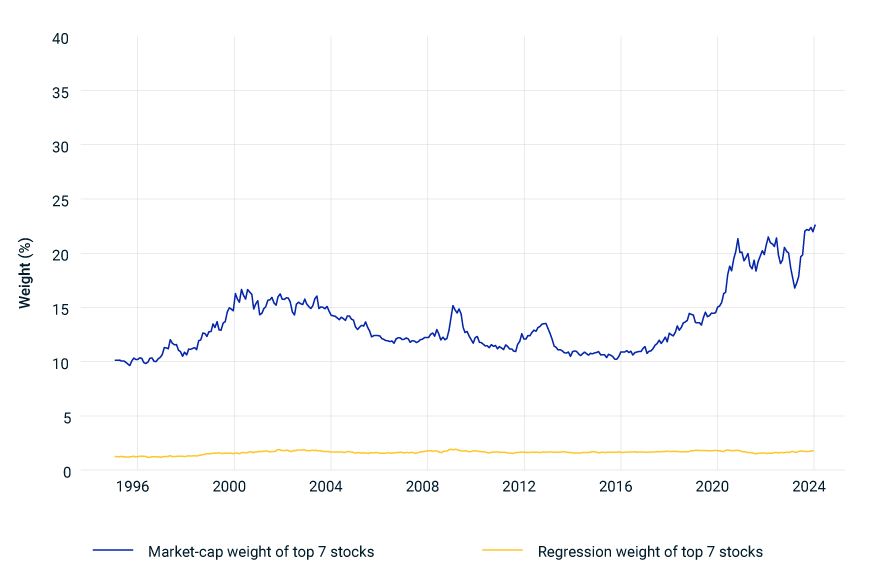
Data period is from January 1995 through October 2023. The exhibit compares the market and model weights of the top seven stocks in the MSCI USA IMI.
We analyzed extremes in portfolio concentration by dividing the MSCI USA IMI into 20 market-cap segments, creating portfolios of approximately 125 stocks each. These portfolios, including the Magnificent 7 stocks in the largest segment, were market-cap weighted. To evaluate risk-forecast accuracy, we used a bias statistic, which shows the ratio of actual to forecast risk.[2] A bias of 1.0 implies accurate risk prediction, while values over 1.0 indicate higher actual risk than the forecast.
For most of the 20 portfolios, the average bias statistic, based on the EFMUSATR forecasts, hovered near 1.0 from April 2011 through October 2023. The bias of the largest stock portfolio averaged 1.02. Despite the overall accuracy, the risk could still be under- or overestimated at times. We also examined the rolling bias statistics for the largest portfolio (quantile 20) as well as for the entire MSCI USA IMI and the MSCI USA Quality Index.[3] The Magnificent 7 stocks composed about 26% of the MSCI Quality Index, on average, in 2023 through October. Our findings indicate that even during the concentrated market conditions of 2023, our risk forecasts remained in line with actual risk.
Risk-forecast accuracy has not degraded in the recent market environment
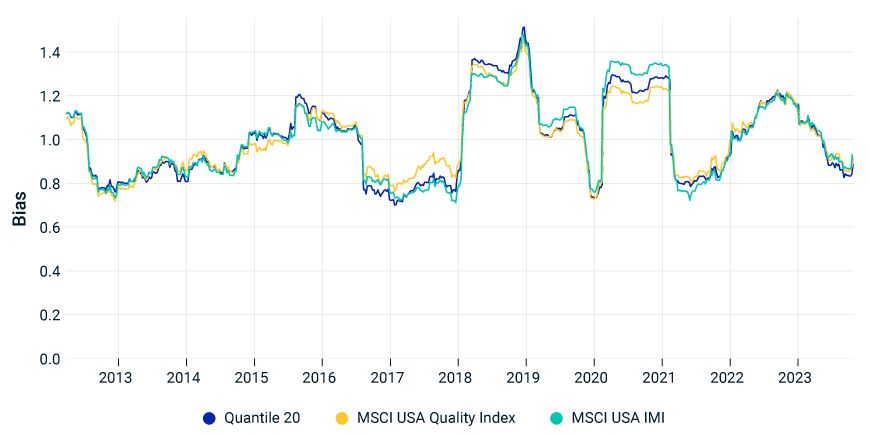
Data period is from April 2011 through October 2023. The exhibit plots the average bias statistic, based on the EFMUSATR forecasts, for the 20 largest market-cap stocks of the MSCI USA IMI (quantile 20), the MSCI USA Quality Index and the MSCI USA IMI.
Our analysis over the last 12 years showed a consistent pattern of bias across all portfolios, including the highly concentrated quantile 20. This uniformity suggests that market-wide effects, rather than specific or missing factors, influenced the bias. Closer examination reveals that short periods of major market downturns, specifically in February and December 2018 and in March 2020, were key drivers of the observed bias from 2018 through 2021.
Would adding a Magnificent 7 factor to the model have affected its accuracy? The factor we tested, which we call the Top 7, flagged the largest seven stocks in the MSCI USA IMI universe since April 2011. Integrating this factor into the model for the MSCI USA Quality Index showed no significant improvement in the model's risk-forecast accuracy.
Adding the Top 7 factor did not improve risk-forecast accuracy
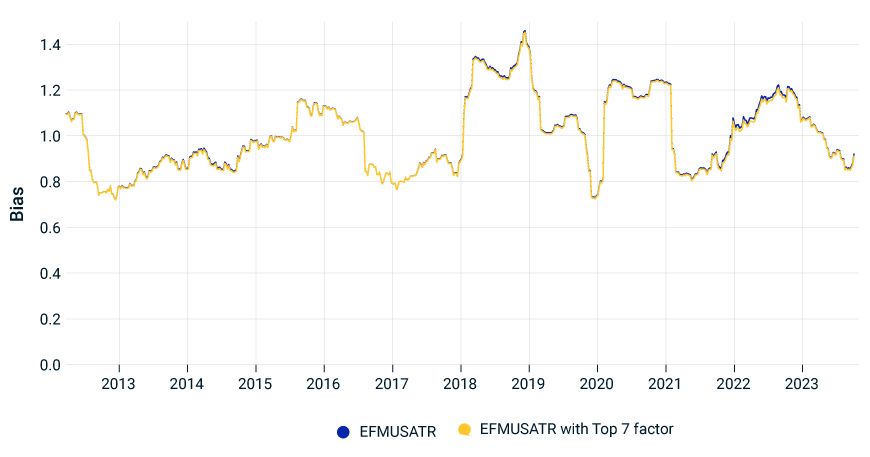
Data period is from April 2011 through October 2023. The exhibit plots the average bias statistic for the MSCI USA Equity Factor Trading Model (EFMUSATR) with and without the Top 7 factor for the MSCI USA Quality Index.
The insights from our analysis show that the MSCI risk model's forecasts have remained robust across changing market conditions and shifting portfolio concentrations. Its consistency over time, in more- and less-concentrated periods, reinforces the reliability of the EFMUSATR's stock-weighting approach in diverse market scenarios.


Subscribe todayto have insights delivered to your inbox.
1 The MSCI USA IMI universe contains about 2,500 stocks. The 99th percentile is thus composed of 25 stocks.2 The bias statistic is defined as the standard deviation of standardized portfolio returns, where z = R/σ is the standardized return, R is the portfolio return over a period and σ is the beginning-of-period volatility forecast. With perfect forecasts, the standardized return has an expected standard deviation of one. The bias statistic for the portfolio is the realized standard deviation of standardized returns over a lookback window.3 In earlier research, we showed that the MSCI ACWI Quality and MSCU USA Quality Indexes experienced the greatest impact from the Magnificent 7 stocks compared to other factor indexes.
The content of this page is for informational purposes only and is intended for institutional professionals with the analytical resources and tools necessary to interpret any performance information. Nothing herein is intended to recommend any product, tool or service. For all references to laws, rules or regulations, please note that the information is provided “as is” and does not constitute legal advice or any binding interpretation. Any approach to comply with regulatory or policy initiatives should be discussed with your own legal counsel and/or the relevant competent authority, as needed.