AI’s Moment and Insights from Themes Past
- The AI-driven rally has pushed today's market concentration to levels not seen since the 1970s, emphasizing the impact that a few large firms have had in shaping recent market returns.
- History reveals that market-leading firms have often struggled to keep up with the broad market over time, hinting at the challenge the largest firms face in retaining their leadership positions.
- These insights may help when analyzing today's largest stocks (also marked by high crowding) and suggest that broader exposure to an investment theme may have been more fruitful than looking for winners within that theme.
Everybody wants to rule the world
Today, the top 10 stocks in the World, driven by the AI rally, account for over 20% of its capitalization, as shown below. This exceeds past periods of heightened market concentration, such as the early 2000s internet boom, 1990s Japanese finance bubble and post-oil-shock phase of the 1980s. Only during the mid-1970s, when a handful of U.S. industrial companies dominated the World, was concentration on par with current levels.
Today's 10 largest firms account for a fifth of the market's capitalization

Point-in-time weight of the top 10 stocks in the MSCI World Index from December 1974 through July 2023. Labels represent periods of elevated market concentration. Weight is based on a security's free-float market capitalization. Current concentration is as of July 31, 2023.
What happened to the leading companies of these eras? Several firms, such as IBM and General Electric Co., survive today, albeit with different business models and reduced market weight compared to their historical peaks. Some were diminished due to regulatory action (e.g., AT&T Inc.) or industry consolidation (e.g., Atlantic Richfield Co.). Fast-paced market shifts disrupted others, like Lucent Technologies Inc., which itself was once considered an industry disruptor.
Ten largest stocks in the World through five market eras
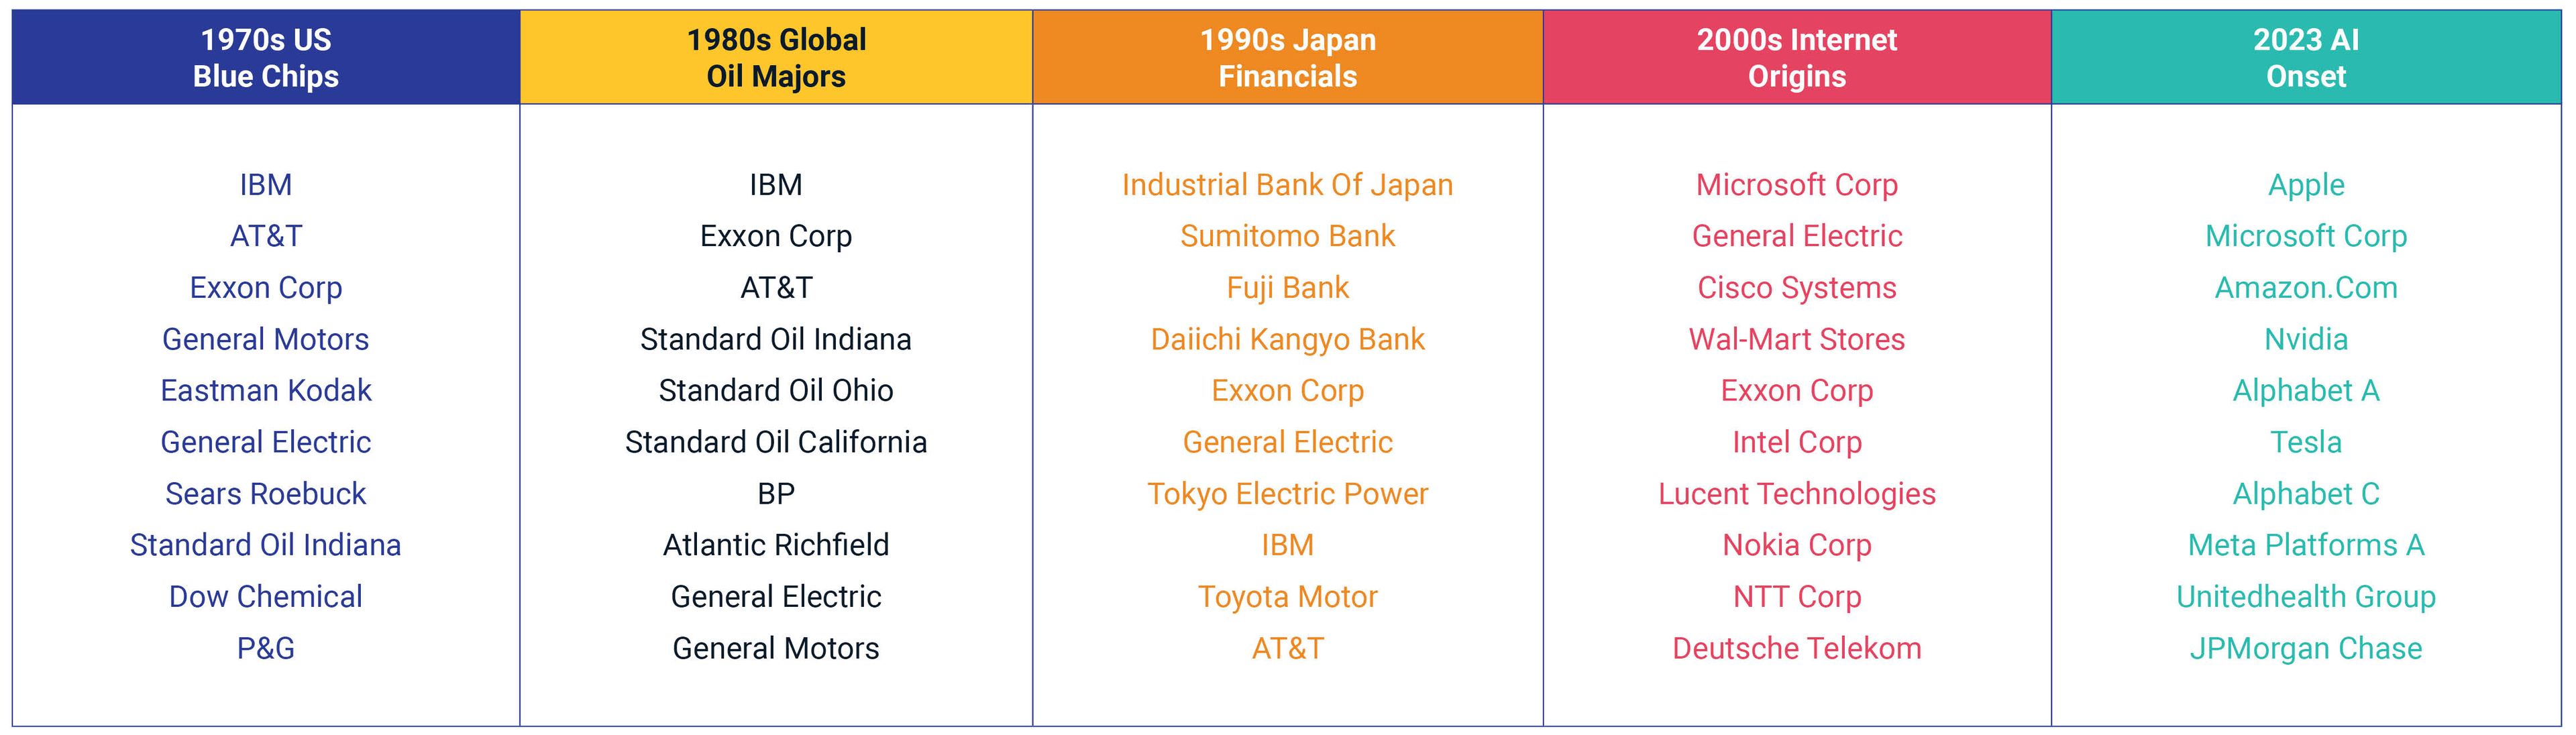
Ten largest securities by weight in the MSCI World Index as of month-end December 1976, November 1980, December 1989, December 1999 and July 2023.
Our analysis from the four prior eras revealed that the market weight of the largest companies in those eras was significantly lower after a decade, as illustrated below. Rather than marking the inception of empires without end, a company's ascent to the top often signaled impending challenges. That could lend support to Joseph Schumpeter's "perennial gale of creative destruction" in reshaping equity markets.2 The outsized profits and growth opportunities that catapulted these companies to their peak often paved the way for rising competitors and, ultimately, their own struggles.
Leaders from each era had a smaller market weight a decade later

Darker shades indicate weight of 10 largest stocks at peak concentration (dates noted above). Lighter shades indicate weight of the same 10 securities one decade later.
Most firms struggled after reaching the leader board
Next, we traced the trajectory of all companies that made it to the top 10, beyond the four well-known eras already discussed. Indeed, of the approximately 5,300 firms listed in the World since 1974, a scant 75 made it to the top 10. This underscores another aspect of creative destruction: the durability of incumbent firms in keeping new entrants at bay.
Durability, however, didn't always equate to favorable outcomes, as most of these leaders eventually struggled to keep pace with the market. Our findings showed that only one-fourth of the leaders — 19 out of 75 — managed to exceed the World's returns in the years after reaching the top 10 (green traces below).
In fact, most lagged the market (red traces). This was either a result of gradual deterioration, exemplified by the Japanese bank Sumitomo; or intermittent periods of progression and regression as witnessed with GE; or, in more uncommon scenarios, a swift recalibration of investor sentiment, as seen with Lucent.
Only one-quarter of leaders kept pace with the market after reaching the top 10

Each line represents the gross stock level in USD relative to the MSCI World Index (log-scaled) from the month following the security first making the top 10 until its most recent trade. Full period is from December 1974 through June 2023.
Is it getting crowded in here?
Finally, we used the MSCI Stock Crowding Model to gain another perspective on market leaders starting from 1996, the earliest date available in the model. Historically, the largest stocks were not significantly more crowded than the broader market, based on indicators such as valuation, short interest and volatility. This reaffirms our previous observation that slow erosion was more common than a rapid drawdown indicative of a reversal in crowding.
Presently, the largest stocks do show a higher level of crowding, as shown below. This trend among the leaders accelerated through the COVID-19-era rally, when the largest stocks' volatility (more so than their valuations) drove crowding levels up. This might be an additional, short-term risk for investors to contemplate, alongside the long-term risks faced by market leaders.
Today's leaders and the risk of crowding

Crowding scores are a capitalization-weighted measure of the 10 largest stocks each month in the MSCI World Index from January 1996 through June 2023. Values above the dashed line typically indicate elevated crowding.
While the lure of holding the leading companies in ascendant themes can be compelling, the historical trajectory of market leaders bears noting. Their ascent often preluded a period of below-market returns. This insight is helpful both for navigating emerging fields such as thematic investing and for understanding our current era of market concentration.
Further Reading

Subscribe todayto have insights delivered to your inbox.
1The MSCI World Index tracks large and mid-size companies in developed markets. The number of its constituents has ranged from approximately 1,000 to 2,000 throughout the history covered in this blog post, December 1974 through July 2023.2Joseph A. Schumpeter, New York: Harper & Brothers, 1942.
The content of this page is for informational purposes only and is intended for institutional professionals with the analytical resources and tools necessary to interpret any performance information. Nothing herein is intended to recommend any product, tool or service. For all references to laws, rules or regulations, please note that the information is provided “as is” and does not constitute legal advice or any binding interpretation. Any approach to comply with regulatory or policy initiatives should be discussed with your own legal counsel and/or the relevant competent authority, as needed.