ESG and Climate In Focus: 2023 Index Performance Review
Key findings
- The MSCI ESG Indexes reflect objectives such as excluding controversial stocks and integrating MSCI ESG Ratings, and the MSCI Climate Indexes capture objectives such as reducing carbon emissions and mitigating climate risks.
- Four of the five flagship MSCI ACWI ESG Indexes outperformed their parent in 2023. The two highest outperformers were the MSCI ACWI SRI (3.4%) and MSCI ACWI ESG Screened (2.0%) Indexes, stated in USD.
- Three of the five flagship MSCI ACWI Climate Indexes performed similarly to their parent index, while the MSCI ACWI Climate Action and MSCI ACWI Climate Change Indexes had USD active returns of 2.7% and 6.5%, respectively.
Over 2023, an often-tumultuous year on many fronts, the MSCI ESG and MSCI Climate Indexes met or exceeded their stated objectives. Let's take a closer look.
MSCI ESG Indexes
The MSCI ESG Indexes are constructed to reflect various investor motivations, such as excluding controversial stocks, integrating ESG considerations while maintaining a risk profile similar to the parent index, selecting the highest-rated ESG stocks in each sector or maximizing an index's ESG score while limiting tracking error to the parent index.
A review of the 2023 performance of the flagship MSCI ESG Indexes shows that the MSCI SRI Indexes had the greatest return dispersion across regions — a 10.5% spread between the U.S. and Japan — while the MSCI ESG Focus Indexes had the lowest variability — a 1.1% difference between the U.S. and emerging markets (EM).
2023 performance of the flagship MSCI ESG Indexes across regions
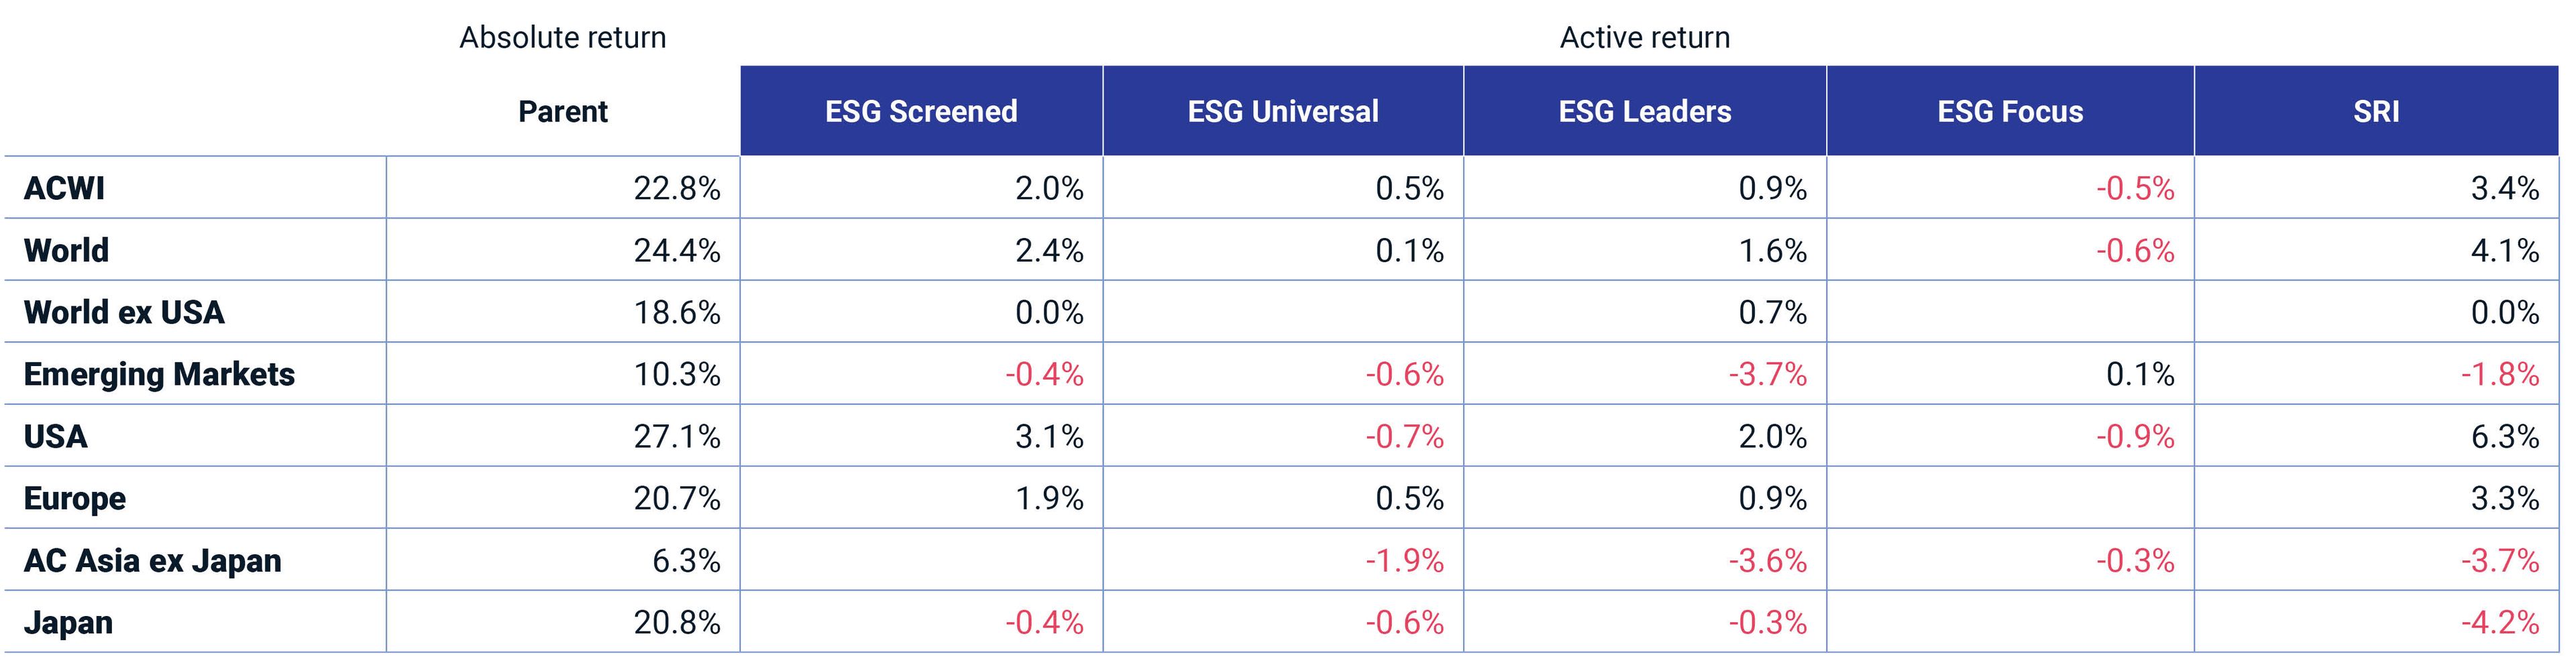
The table shows gross return in USD from December 2022 to December 2023.
During 2023, the MSCI ESG Indexes' returns were positively impacted by the volatility and downward trend in oil prices and the effect on the Global Industry Classification Standard (GICS®)[1] energy and utilities sectors. The performance of the Magnificent Seven, thanks in part to the growth in artificial intelligence, boosted returns in the information-technology (IT), communication-services and consumer-discretionary sectors. Given the outperformance of the MSCI ACWI ESG Screened and MSCI ACWI SRI Indexes, we examined these in greater detail to understand how their methodologies impacted their returns.
Two sectors and stock-specific return boosted performance
The MSCI ACWI ESG Screened and MSCI ACWI SRI Indexes had the highest average active exposure to the IT sector, and both had the lowest active exposure to the energy sector. The MSCI ESG Indexes are constructed to avoid sector concentration, but because the MSCI ESG Screened Indexes also apply a 30% reduction in carbon emissions relative to the parent index, they were underweight in the energy sector. In contrast, the MSCI ACWI SRI Indexes are designed to be sector-neutral, but sharp price movements between index rebalances can create sector underweights or overweights.
Average active sector weights of the MSCI ACWI ESG and Climate Indexes

Based on monthly data from December 2022 to December 2023.
Our performance attribution shows that within the IT sector, IT services and software and semiconductor companies boosted returns of the MSCI ACWI ESG Screened and MSCI ACWI SRI Indexes. The energy sector's oil and gas exploration and production companies also contributed positively. And although these sectors added to the outperformance of both indexes, the Magnificent Seven accounted for about 30% of the return of the MSCI ACWI Screened Indexes and most of the stock-specific return of the MSCI ACWI SRI Indexes.
2023 active-return attribution for the MSCI ACWI ESG Screened and MSCI ACWI SRI Indexes

A range of ESG profiles are on offer
Compared to their parent index, the MSCI ACWI ESG Indexes offer different combinations of value- or constraints-based considerations and integration of financially relevant MSCI ESG Ratings — for example, higher ESG scores (except for the MSCI ACWI ESG Screened Indexes[2]) and lower red-flag ESG controversies.
Year-end 2023 weighted-average ESG score of MSCI ESG Indexes
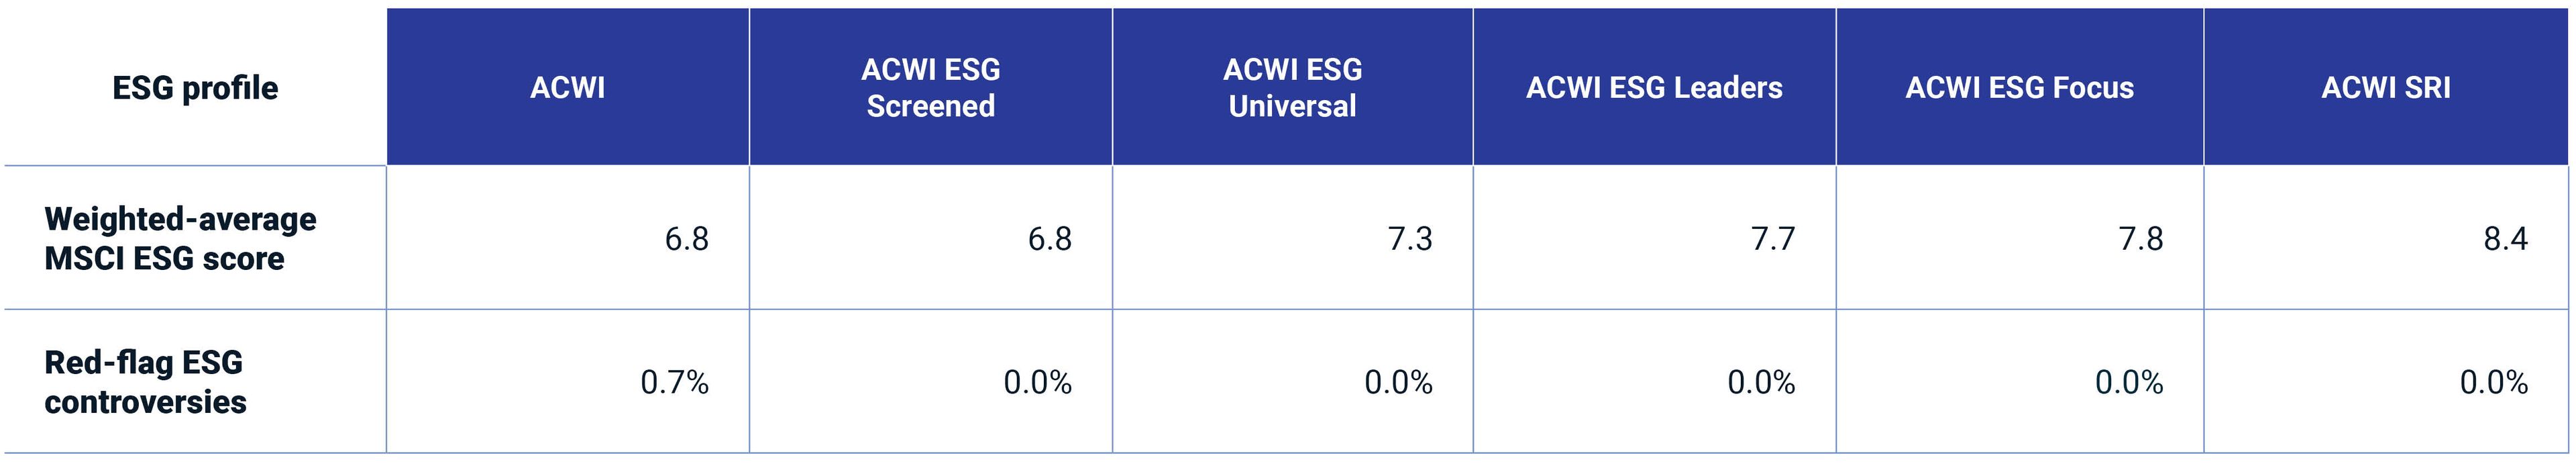
As of December 2023.
A closer look at the sector-level performance of the MSCI ACWI SRI Index shows that the weighted-average ESG score for the IT sector was the highest among all sectors at the end of 2023.
Year-end 2023 weighted-average MSCI ESG score by sector for MSCI ACWI SRI and MSCI ACWI Indexes

As of December 2023.
MSCI Climate Indexes
Like the MSCI ESG Indexes, the MSCI Climate Indexes are constructed to represent one or more of the following investor goals: reduce carbon emissions, manage climate risks, increase exposure to green revenue and align with net-zero objectives. Over 2023, the MSCI ACWI Climate Action and MSCI ACWI Climate Change Indexes outperformed the MSCI ACWI Index by 2.7% and 6.5%, respectively.
2023 performance of the flagship MSCI Climate Indexes across regions
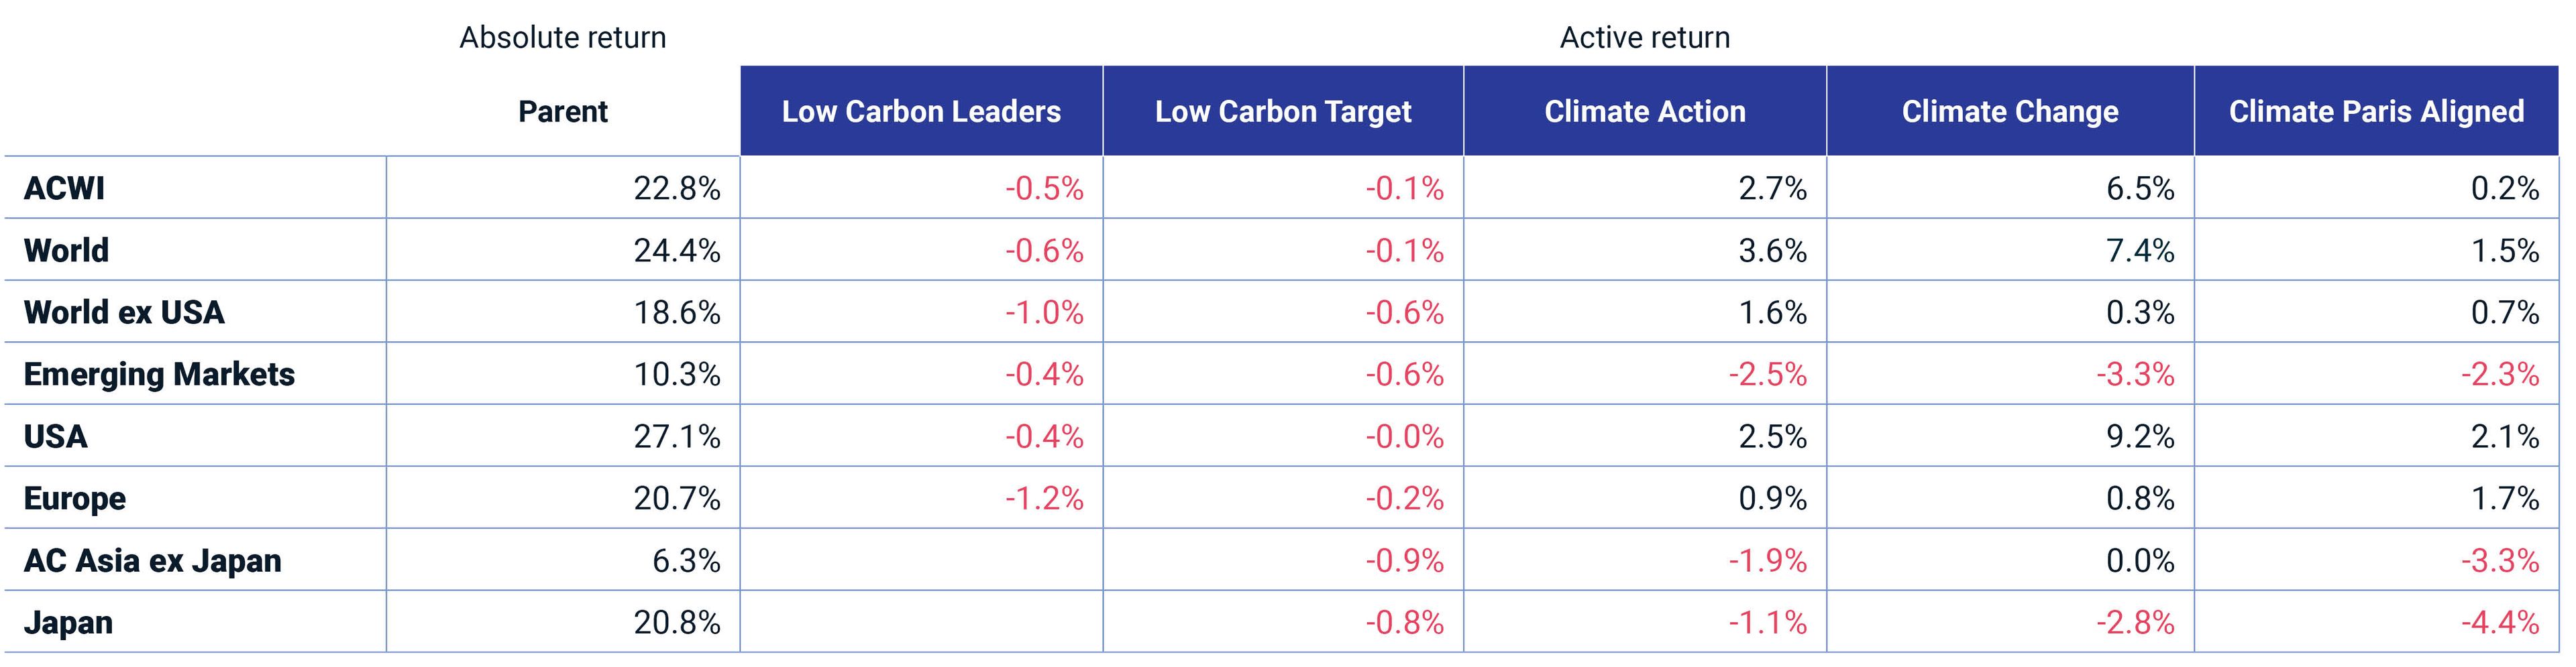
The table shows the gross return in USD from December 2022 to December 2023.
While various industries, including software and semiconductors, contributed to the active return of the MSCI ACWI Climate Indexes, the performance of the Magnificent Seven generated most of the stock-specific return.[3] In Japan and EM, value stocks outperformed during the year, negatively impacting those regions' MSCI Climate Action, MSCI Climate Change and MSCI Climate Paris Aligned Indexes because they underweighted value stocks, which tend to have higher carbon emissions.[4]
We compared several metrics that, while not common to all indexes, can help us understand current levels of decarbonization, percentage of companies disclosing targets aligned with the Science Based Targets initiative (SBTi) and percentage of revenues derived from green businesses. As of December 2023, compared to their parent index, all of the MSCI ACWI Climate Indexes had lower carbon intensity, higher green revenues (except for the MSCI ACWI Low Carbon Leaders Index) and higher SBTi-approved targets (except for the MSCI ACWI Low Carbon Leaders and ACWI Low Carbon Target Indexes).
Comparison of selected climate metrics
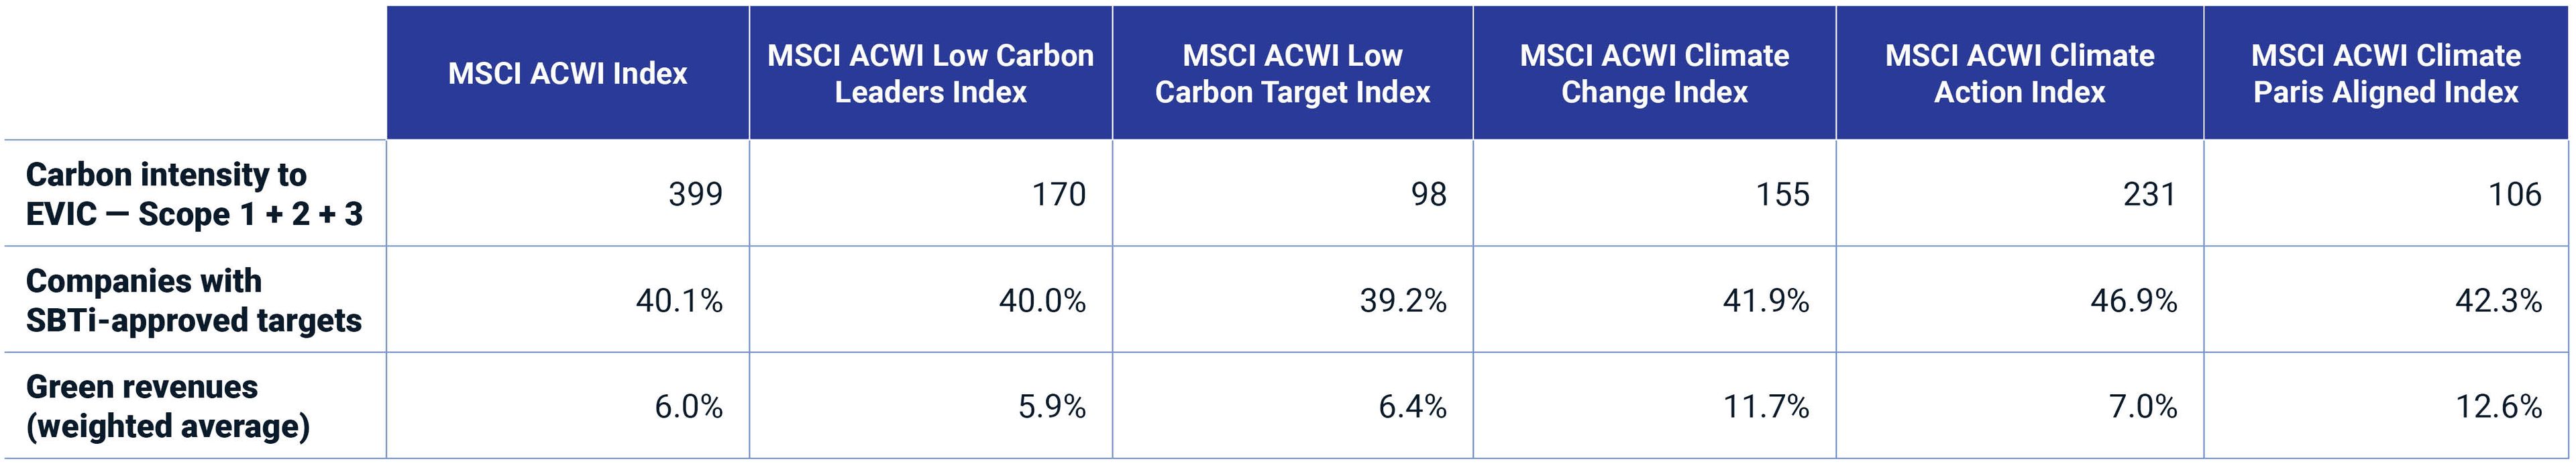
As of December 2023. "EVIC" is enterprise value including cash. "SBTi" is science-based target.
MSCI ESG and Climate Indexes met or exceeded stated objectives
In 2023, even as markets experienced the growth of the Magnificent Seven and felt the impact from ongoing volatility in the oil market, the MSCI ESG Indexes continued to meet their stated objectives, including maximizing ESG score while limiting tracking error or selecting the highest-rated ESG stocks by sector. And for the year, the MSCI Climate Indexes showed lower carbon emissions and, generally, a larger percentage of revenues from green businesses when compared to their parent index.


Subscribe todayto have insights delivered to your inbox.
1 GICS is the global industry classification standard jointly developed by MSCI and S&P Global Market Intelligence.2 The MSCI ESG Screened Indexes apply certain exclusions common among institutional investors to avoid reputational risks and mitigate financial risks but do not explicitly target higher index-level ESG scores.3 For 2023, the stock-specific return for the MSCI ACWI Climate Action and MSCI ACWI Climate Change Indexes was 1.7% and 4.2%, respectively.4 As of December 2023, Scope 1+2+3 carbon intensity to enterprise value including cash (EVIC) for the MSCI Japan Value Index was 1,002 compared to 150 for the MSCI Japan Climate Paris Aligned Index, and the carbon intensity of the MSCI Emerging Markets Value Index was 1,098 compared to 141 for the MSCI Emerging Markets Climate Paris Aligned Index.
The content of this page is for informational purposes only and is intended for institutional professionals with the analytical resources and tools necessary to interpret any performance information. Nothing herein is intended to recommend any product, tool or service. For all references to laws, rules or regulations, please note that the information is provided “as is” and does not constitute legal advice or any binding interpretation. Any approach to comply with regulatory or policy initiatives should be discussed with your own legal counsel and/or the relevant competent authority, as needed.