Footprinting the World’s Largest Asset Managers
- Our research to assess the carbon footprint of the world's 10 largest asset managers revealed that big European players were marginally less carbon-intensive than their U.S. peers.
- We found that assets under management were proportional to larger financed emissions. This was particularly true at U.S. fund managers in our peer group, where each USD trillion invested led to an extra 10-20 tons of CO2.
- Asset managers with net-zero commitments may want to assess their entire book of assets to have a baseline for target setting and to be able to monitor alignment progress, alongside engagement and decarbonization efforts.
Europe led the way
U.S. firms accounted for seven of the 10 largest asset managers, with the remainder European. On carbon intensity3 (Scope 1 and 2), the European fund managers were clustered below or around 150 tons CO2/USD million sales, while U.S. ones hovered closer to 200 tons CO2/USD million (see the exhibit below). European fund providers generally had more strategies focusing on European companies, which were often better positioned versus their non-European peers in addressing environmental risks. This also aligns with findings from the most recent NZAM net-zero alignment progress report4 and signatory corporate disclosures, which indicated that the European asset managers within this sample generally had a higher initial percentage of their AUM committed to be managed in line with net-zero (ranging between 20%-35%) relative to the U.S. ones (ranging between 10%-25%).
Carbon intensity and financed emissions vs. AUM
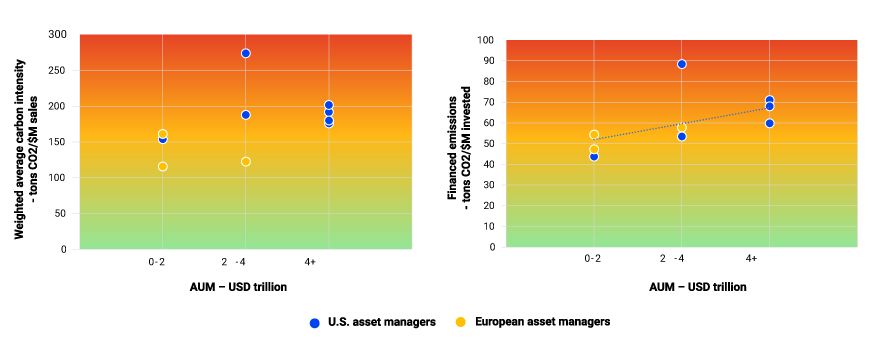
Source: MSCI ESG Research, as of Oct. 12, 2022.
Size mattered, but asset class did not
Size mattered when it came to financed emissions.5 We observed a moderate correlation between AUM and financed emissions. With a larger breadth of fund offerings across geographies and sectors, the larger fund providers exhibited higher financed emissions.
The asset manager exhibiting the highest carbon intensity and financed emissions was a global bond fund manager with significant exposure to emerging markets and high yield debt. Among U.S. fund managers, each USD trillion invested led to an extra 10-20 tons of CO2. Comparing equity and fixed income assets revealed a clustering of carbon intensity between 100-200 CO2/USD million sales for both asset classes. Further, we found that asset managers with more carbon-intensive equity assets were likely to have more carbon-intensive fixed income assets.
Carbon intensity: equity vs. fixed income
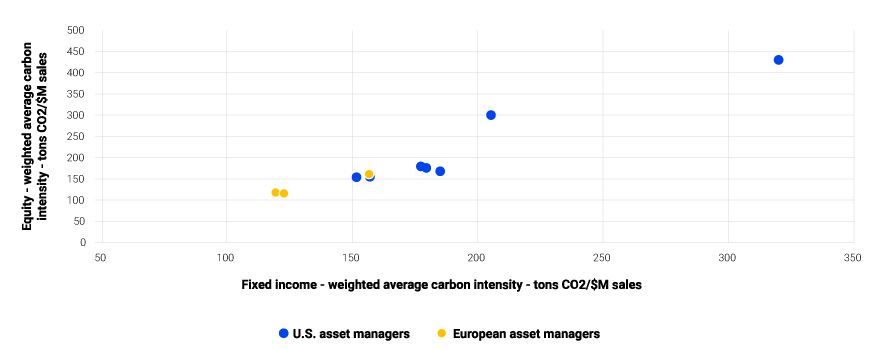
Source: MSCI ESG Research, as of Oct. 12, 2022.
Footprinting at the enterprise level
For investors, assessing the carbon footprint of a portfolio is often the first step in addressing the investment implications of climate change. Although it can be a complex data exercise, asset managers with net-zero commitments may similarly assess all their assets across all funds to help support their ongoing emission reduction efforts and commitments.
Further Reading

Subscribe todayto have insights delivered to your inbox.
1MSCI ESG Research, Sept. 30, 2022.2Asset types that fall out of footprinting coverage include commodities, derivatives, securitized assets and municipal bonds.3Carbon intensity, at the company level, is an efficiency ratio defined as annual carbon emissions/annual sales. Since companies with higher carbon intensity are likely to face more exposure to carbon-related market and regulatory risks, this metric indicates a portfolio’s exposure to potential climate-change-related risks relative to other portfolios or a benchmark. Agnostic to ownership share, it also facilitates comparison with non-equity asset classes.4“Net Zero Asset Managers initiative Progress Report.” NZAM, 2021.5Represents a normalized measure of a portfolio's contribution to climate change that apportions companies’ carbon emissions across all outstanding shares and bonds. This figure measures the total annual Scope 1 and 2 carbon emissions (reported or estimated) associated with USD 1 million invested in the portfolio. It is calculated as the sum of companies’ carbon emissions weighted by the most recently available enterprise value including cash (EVIC) and by the weight of companies in the portfolio.
The content of this page is for informational purposes only and is intended for institutional professionals with the analytical resources and tools necessary to interpret any performance information. Nothing herein is intended to recommend any product, tool or service. For all references to laws, rules or regulations, please note that the information is provided “as is” and does not constitute legal advice or any binding interpretation. Any approach to comply with regulatory or policy initiatives should be discussed with your own legal counsel and/or the relevant competent authority, as needed.