Have Corporate Reforms in Japan Unlocked Shareholder Value?
Key findings
- After regulatory changes, investors in Japanese companies have been more willing to hold boards accountable for governance and performance issues, as evidenced by more votes against directors.
- Japanese companies’ capital efficiency has trailed global peers over the last 30 years.
- A key factor in assessing the direction of the Japanese stock market will be whether companies can meet their cost of capital by improving capital efficiency.
The Japanese equity market's resurgence in performance that began over two years ago has been ascribed to investors' reallocating assets out of China, the seeming end of nearly two decades of deflation, regulatory reforms and a long-sought corporate refocus on shareholder value.[1]
In this blog post we assess the degree to which regulatory reforms have changed corporate fundamentals and governance. Our conclusion is that although governance practices have made progress, improvements in fundamentals have lagged, which may become a concern as investors assess their portfolios' allocations to this market.
Capital efficiency and margins still disappoint
Capital efficiency and return on equity (ROE) have become major talking points between investors and companies.[2] Scrutiny is likely to increase with the Tokyo Stock Exchange (TSE) now maintaining a monthly list of companies that voluntarily disclose information regarding "actions to implement management that is conscious of cost of capital and stock price."[3] The TSE initiative was designed to shine a light on the half of TSE-listed companies with a price-to-book (P/B) ratio below one (i.e., market value below book value). These low P/Bs indicate that asset values were still being discounted to reflect low estimates of future earnings or that many Japanese companies were eroding value in their use of shareholder capital.
The ROE of Japanese mid- and large-cap companies has remained lower than those of their U.S. and European peers for more than 30 years. In part, the lower ROE reflects Japanese companies' lower leverage based on a DuPont-style ROE decomposition, which breaks down the metric into net profit margin, asset turnover and leverage. Lower debt has resulted in higher asset turnover, however, partially offsetting this effect. Lower net profit margins have also depressed ROE.[4] In general, lower margins have stemmed from weaker gross profitability. An improvement in gross profit margins would require changes in cost structures, supplier strategy and pricing.
Selected fundamental metrics for Japanese, US and European equity markets
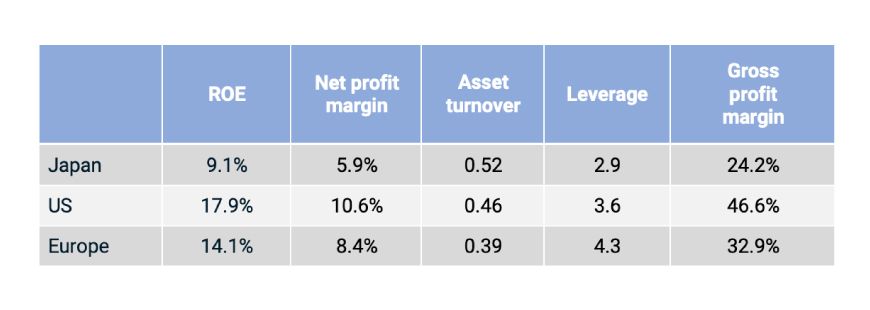
Data as of Dec. 29, 2023. The measures for Japan, U.S. and Europe are based on the constituents of the MSCI Japan, MSCI USA and MSCI Europe Indexes, respectively.
Governance push aims to improve financial performance
The proportion of Japanese companies with a P/B below one may indicate that Japan's management culture has historically placed insufficient priority on shareholder value.[5] One aim of Japan's adoption and subsequent revisions of its Stewardship Code and Corporate Governance Code has been to encourage alignment between shareholder and corporate interests and to promote board accountability.[6] Investor and regulatory pressures have focused on increasing board independence to improve management oversight and discourage practices that may insulate management from pressure to unlock shareholder value.
Cross-shareholdings[7] — rare in other developed markets — have historically been maintained by Japanese companies to support business relations. The practice has been criticized as an inefficient use of capital, with longstanding calls to unwind such relations.[8] The percentage of constituents in the MSCI Japan Index flagged for cross-shareholdings in 2023 dropped to 36%, down from 43% in 2019. Simultaneously, poison pills — often criticized by investors as limiting opportunities for shareholders to consider potentially favorable takeover bids — have notably declined. The percentage of the MSCI Japan Index's constituents flagged for a poison pill in 2023 dropped to 1.8%, down from 5.6% in 2019.
Percent of Japanese, US and European companies flagged for selected governance key metrics
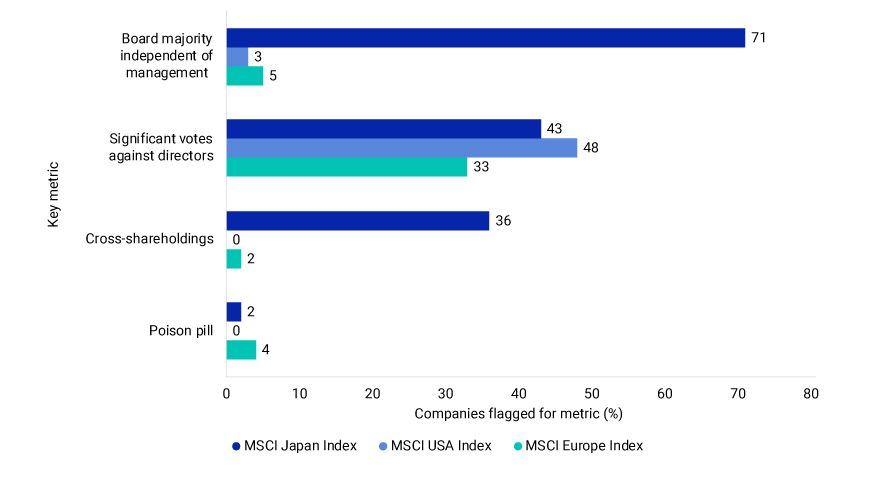
Source: MSCI ESG Research. Data as of December 2023, for constituents of the MSCI Japan Index (n = 225), MSCI USA Index (n = 603) and MSCI Europe Index (n = 407), which are composed of mid- and large-cap companies. The "board majority independent of management" key metric flags issuers when less than 51% of the board is independent of management. The "significant votes against directors" key metric flags if one or more directors on the board received a negative or withheld shareholder vote in excess of 10% in the most recently reported election. Both metrics are defined in the MSCI ESG Ratings methodology.
Shareholder voting behavior shifted markedly following the adoption of the Stewardship Code in 2014. Since 2016, the share of boards flagged for having less than a majority of directors who are independent of management — often regarded as best practice by investors — has decreased at a rate roughly consistent with the increase in boards flagged for significant votes against directors. The changes in these metrics suggest investors may be more willing to hold boards accountable for perceived governance and performance failings.
Board accountability and independence at Japanese companies
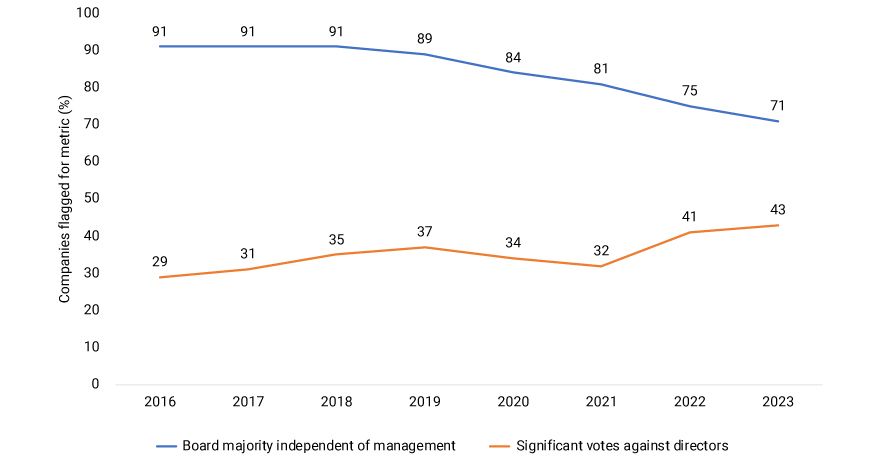
Data from Dec. 31, 2016, to Dec. 31, 2023, for constituents of the MSCI Japan Index. The "board majority independent of management" key metric flags issuers when less than 51% of the board is independent of management. The "significant votes against directors" key metric flags if one or more directors on the board received a negative or withheld shareholder vote in excess of 10% in the most recently reported election. Both metrics are defined in the MSCI ESG Ratings methodology.
Improving capital efficiency may be key to continued strong equity performance
Outperforming global equity markets over the last two years, the Japanese stock market's rally continued through February 2024. Gross local-currency returns for the MSCI Japan and MSCI ACWI ex Japan Indexes were -4 % and -16% in 2022, and 29% and 22% in 2023, respectively. In USD terms, the gross returns of the two indexes were -16% and -18% in 2022, and 21% and 23% in 2023, respectively. The performance of Japanese stocks can be largely attributed to sales growth.[9] Earnings growth, however, has not followed in step, and margins have deteriorated.
Decomposition of Japanese, US and European equity-market returns
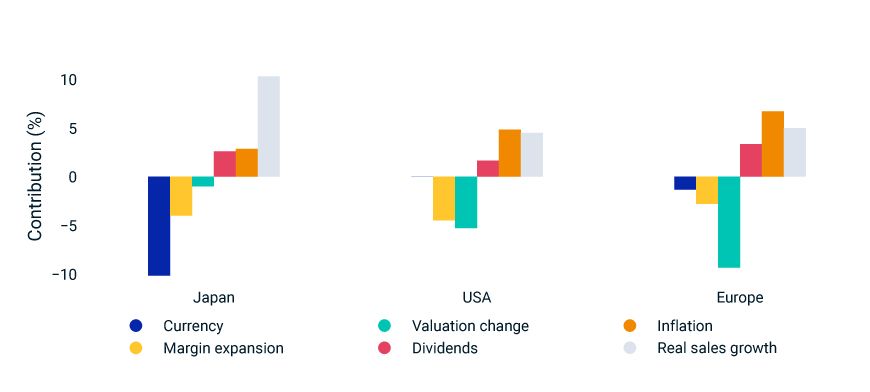
Source: U.S. Bureau of Labor Statistics, Eurostat, Portal Site of Official Statistics of Japan. Data from Dec. 31, 2021, to Dec. 29, 2023, based on gross return in USD for the MSCI Japan, MSCI USA and MSCI Europe Indexes, respectively.
The gradual improvements in Japanese firms' governance practices have occurred in response to both investor and regulatory pressures. The question now is whether external pressure can similarly enhance capital efficiency. Attaining greater capital efficiency may be the key to unlocking shareholder value and continued strength in the Japanese equity market.


Subscribe todayto have insights delivered to your inbox.
1 Leo Lewis, “How Japan got its swagger back,” Financial Times, May 19, 2023.2 “ICGN Japan Governance Priorities Published 04 October 2022.” International Corporate Governance Network, Oct. 4, 2022.3 “Tokyo Stock Exchange, Inc. (TSE) Has Published a List of Companies That Have Disclosed Information Regarding 'Action to Implement Management That is Conscious of Cost of Capital and Stock Price,'” Japan Exchange Group, Jan. 15, 2024.4 We also calculated averages for each of the Global Industry Classification Standard (GICS®) sectors in each regional market to address sector bias. Doing so partially removed an upward bias on leverage for European companies that arose from the region's exposure to the financials and utilities sectors, but the link between Japan's low ROE and lower profit margin remained. GICS is the global industry classification standard jointly developed by MSCI and Standard & Poor's.5 As of Dec. 29, 2023, proportions of constituents with P/B below one for the MSCI Japan, MSCI USA and MSCI Europe Indexes were 28%, 9% and 20%, respectively. For historical comparison, as of Dec. 31, 2003, these proportions were 14%, 2% and 9%, respectively.6 Japan's Stewardship Code was adopted in 2014 with revisions published in 2017 and 2020. Japan's Corporate Governance Code was adopted in 2015 with revisions published in 2018 and 2021.7 Under the MSCI ESG Ratings methodology, cross-shareholdings only refer to cases of mutual shareholdings between two companies where both companies have a holding that exceeds 0.5%.8 Wataru Suzuki, “Japan Inc. steps up share sales amid corporate governance push,” Nikkei Asia, Dec. 30, 2023.9 Real sales growth accounts for consumer-price-index inflation in the respective market. In addition to domestic inflation, an increase in export prices from JPY depreciation might have contributed to high nominal sales growth in Japan. As of year-end 2023, Japanese export prices increased by 33% over the previous two years, while U.S. export prices increased by 2% over the same period.
The content of this page is for informational purposes only and is intended for institutional professionals with the analytical resources and tools necessary to interpret any performance information. Nothing herein is intended to recommend any product, tool or service. For all references to laws, rules or regulations, please note that the information is provided “as is” and does not constitute legal advice or any binding interpretation. Any approach to comply with regulatory or policy initiatives should be discussed with your own legal counsel and/or the relevant competent authority, as needed.