High Short Interest and Low Quality Hurt Small Caps’ Performance
Key findings
- Since 1999, small-cap investors enjoyed a positive contribution from size and value, but it did not fully offset the drag from high short interest and low quality over the last five years.
- Before 2019, small caps outperformed big caps, and the drag was not important.
- Understanding how each factor has contributed to or detracted from small caps’ long-term performance could provide useful insights in refining strategy and managing portfolios.
The small-size premium has declined over the last five years, with market dynamics, deglobalization and inflationary pressures having a pronounced impact on this market segment — a trend that has continued into 2024. Over a much longer history of 25 years, however, small-cap stocks consistently outperformed their larger-cap counterparts. We analyzed small caps to learn more about the factors that have influenced their performance since 1999, and what has changed more recently.
Long-term return and risk of big and small stocks across regions
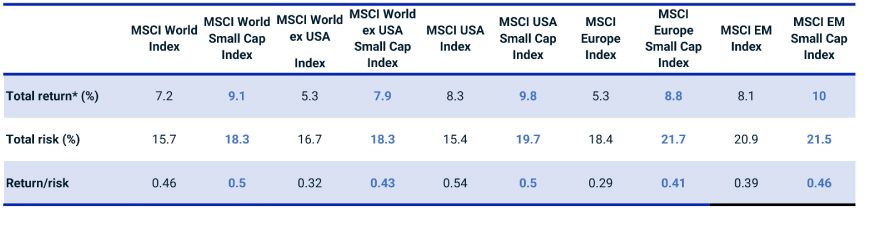
Data from Dec. 29, 1999, to July 31, 2024. *Gross annualized returns are in USD.
In our analysis, small-cap stocks were represented across regions by the MSCI World Small Cap, MSCI USA Small Cap, MSCI World ex USA Small Cap, MSCI Europe Small Cap and MSCI Emerging Markets (EM) Small Cap Indexes. We used MSCI's global equity factor model (EFMGEMLT), one of the MSCI Equity Factor Models (PDF), for performance attributions and factor analysis covering the period from Dec. 31, 1999, to July 31, 2024. Our focus was on understanding the performance drivers of small-cap stocks, not the behavior of the systematic size factor.
Size and value styles were primary positive return drivers over the last 25 years
The overall contribution of aggregated style factors to the returns of small-cap indexes has been positive, with size and value the top positive contributors since Dec. 31, 1999. The largest negative contributors were quality and short interest. Exposures to size and quality were generally negative and, to value and short interest, generally positive.
Style factors have been the main force behind small caps' performance
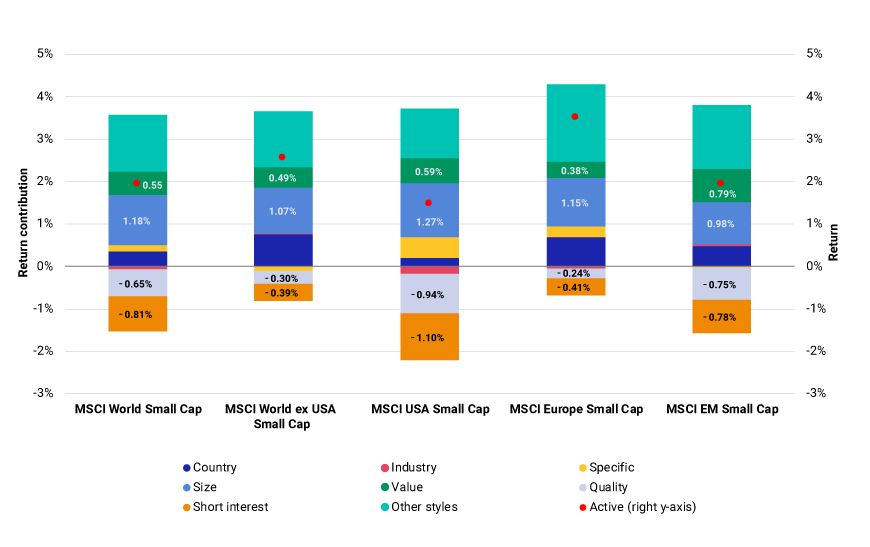
Data from Dec. 29, 1999, to July 31, 2024. Monthly annualized gross returns in USD. Return and return contributions are measured against the corresponding larger-cap index. The analysis was constructed without the short-interest factor before June 2007, when it was added to the EFMGEMLT model, and with the short-interest factor starting in June 2007.
Value and quality factors showed positive long-term performance through the study period, while size, which we define as "big minus small," on average, posted negative performance.[1] The short-interest factor consistently exhibited substantial negative performance, driven by highly shorted stocks that delivered negative returns, in line with short sellers' expectations.
Long-term positive performance for value and quality, negative for size and short interest
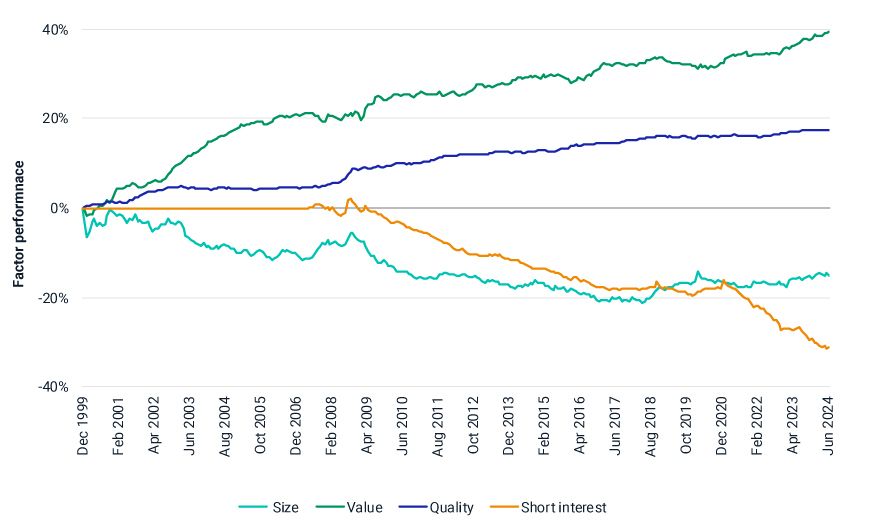
Data from Dec. 29, 1999, to July 31, 2024. Style factors are as represented in the EFGEMLT model. Quality is defined as the equal-weighted average of profitability, investment quality, earnings quality, earning variability and leverage. The analysis was constructed without the short-interest factor before June 2007, when it was added to the EFMGEMLT model, and with the short-interest factor starting in June 2007.
Since 1999, the active size exposure of small-cap stocks has been negative (-2, on average). Small caps have typically had positive active value exposure, particularly in the MSCI World, MSCI USA, MSCI World ex USA and MSCI Emerging Markets Indexes, and the value factor's long-term upward trend has positively impacted the segment's performance.
The quality factor's active exposure has also been negative, although less pronounced in the MSCI World ex USA Small Cap and MSCI Europe Small Cap Indexes.[2] These negative active quality exposures have dampened the segment's performance.
Small caps have often been targets for shorting, and the historical negative return to the short-interest factor has been a drag on small caps' long-term return. The short-interest factor's return was even more negative after December 2020, putting further pressure on small caps' performance. Because low-quality stocks typically have weak balance sheets and high levels of debt,[3] they are also frequently popular shorting candidates.[4]
The double whammy of short interest and low quality
As the following exhibit illustrates, over the last five years, small-cap returns across all regions, except EM, were lower than those of large-cap stocks.
Long-term trend in small-cap outperformance reversed after 2019
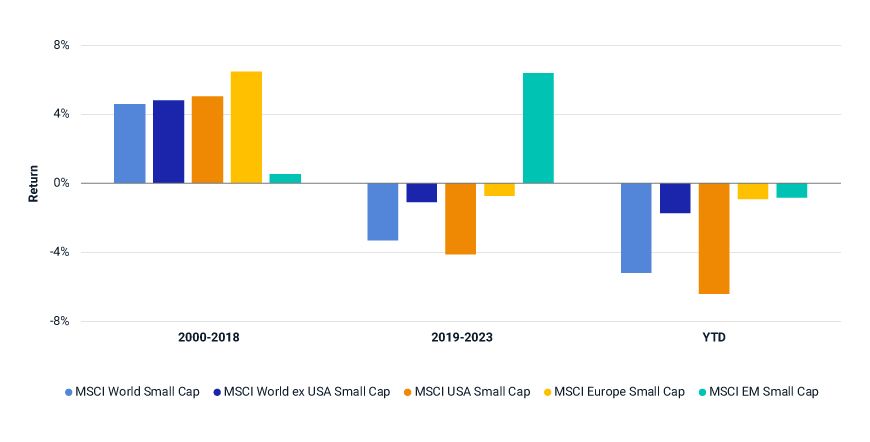
Data from Dec. 29, 1999, to July 31, 2024. Monthly gross returns in USD. Active average calendar-year returns are calculated versus the corresponding larger-cap peers.
Given the drivers of small-cap performance, we examined whether small caps, if screened to remove the lowest-quality and highest-short-interest companies, have delivered performance comparable to large caps? We concentrated our analysis between June 31, 2007, when the short-interest factor was added to the EFMGEMLT model, and July 31, 2024.
Excluding low-quality and highly shorted stocks improved active performance vs. large caps
Loading chart...
Please wait.
We found that, while the small-size premium has declined in recent years, small caps — excluding those with the highest short interest and lowest quality — have matched or outperformed large caps since 2007. Although U.S. small caps have struggled to keep pace with the exceptional performance of large U.S. stocks (particularly in recent years[5]), excluding highly shorted and low-quality stocks would have enhanced the historical active returns of the MSCI USA Small Cap Index.
Our analysis suggests that the recent underperformance of the small-cap indexes in our analysis was not only due to a diminishing small-size premium but to high shorting demand and low quality among their constituents. Reducing exposure to these factors had a positive impact on the historical active performance of small-cap portfolios compared to large caps over our study period.


Subscribe todayto have insights delivered to your inbox.
1 We measure size by the log of market capitalization. The size factor is a strong source of equity-return covariance and captures return differences between large-cap and small-cap stocks.2 The active quality exposure of the MSCI World ex USA Small Cap Index versus the MSCI World ex USA Index was -0.03, and for the MSCI Europe Small Cap Index versus the MSCI Europe Index was -0.05, generally viewed as economically insignificant.3 We have discussed in previous research “The Ups and Downs of Small Caps and Inflation” that rising inflation historically led to negative active performance of small caps' returns.4 Results are not reported here, but based on a quintiles analysis, we found that stocks in the lowest-quality quintiles constituted the majority of stocks in the highest short-interest quintiles.5 For example, between Aug. 31, 2023, and July 31, 2024, the MSCI USA Small Cap Index underperformed the MSCI USA Index by an 8.6% annualized monthly return. The systematic active return was -4.6% and the stock-specific return was -4.0% over the 11-month period.
The content of this page is for informational purposes only and is intended for institutional professionals with the analytical resources and tools necessary to interpret any performance information. Nothing herein is intended to recommend any product, tool or service. For all references to laws, rules or regulations, please note that the information is provided “as is” and does not constitute legal advice or any binding interpretation. Any approach to comply with regulatory or policy initiatives should be discussed with your own legal counsel and/or the relevant competent authority, as needed.