Renewed Optimism for Small-Cap Funds?
As of June 2024, assets under management (AUM) in small-cap funds across all domiciles stood at USD 1.33 trillion, a 50% increase over Dec. 31, 2018, driven by capital appreciation rather than inflows. Net outflows for the period amounted to USD 42 billion. Over the same period, global small caps (MSCI ACWI Small Cap Index) underperformed larger caps (MSCI ACWI Index), returning 9.9% versus 13.3%, respectively.
Actively managed AUM higher, but for how long?
When we compared active versus indexed small-cap funds, two key observations emerged. First, although actively managed funds accounted for a majority (about 59%) of total AUM at the end of June 2024, this percentage was down from 69% at the end of 2018. One explanation for the greater proportion of active funds could be that, compared to larger caps, the small-cap universe tends to offer broader alpha opportunities for active managers.
Our second observation is that although small-cap indexed funds have consistently attracted inflows from investors, active funds have struggled to do so. In 2021, indexed funds' net inflows far surpassed those of active funds at USD 43.4 billion versus USD 2.2 billion. In all other years over our analysis period, small-cap active funds had net outflows, with the largest in 2022, a net drain of USD 54.2 billion.
The net inflows into all small-cap funds, both active and indexed, were positive over the first six months of 2024, and have been net positive over the longer period. Funds with exposure to U.S. small caps, representing approximately 70% of the AUM in our analysis, have had net positive inflows since 2023. Although early days, if the consistent inflows continue, it could indicate a renewed optimism and interest in the small-cap segment.
AUM in active and indexed small-cap funds has grown over the last five years
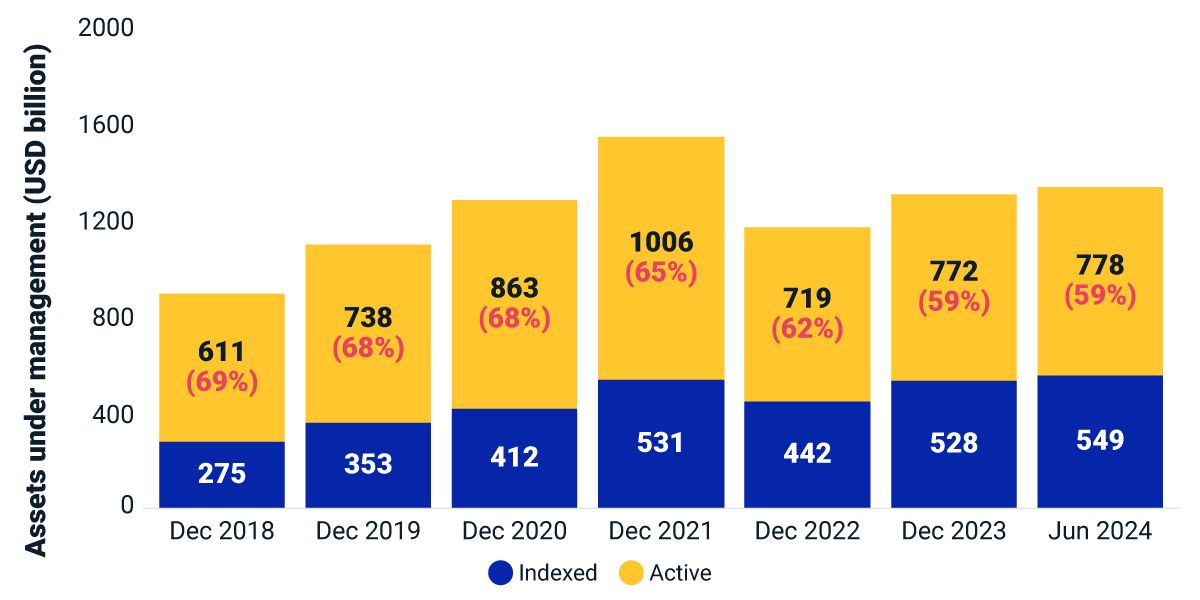
Data at year-end 2018 through 2023, and the six months ending June 2024. Funds (mutual and ETFs and indexed and active) selected using “small cap” and related keywords matched with fund’s name or primary benchmark. Source: Morningstar
Net flows of actively managed small-cap funds have been negative
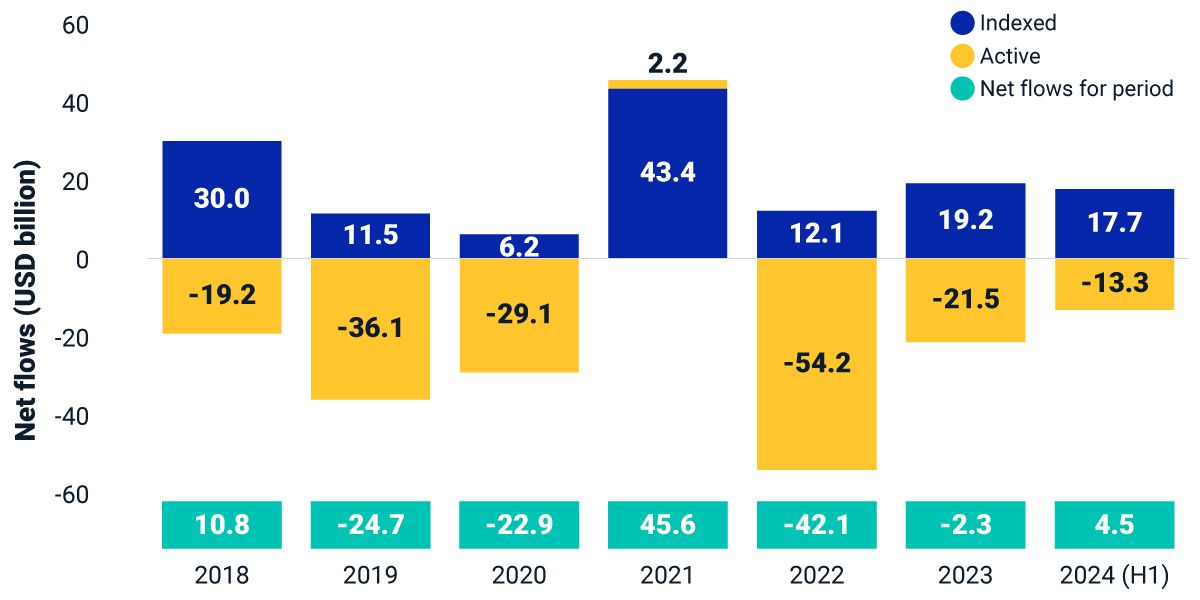
Data at year-end 2018 through 2023, and the six months ending June 2024. Funds (mutual and ETFs and indexed and active) selected using “small cap” and related keywords matched with fund’s name or primary benchmark. Source: Morningstar

Subscribe todayto have insights delivered to your inbox.
Small Caps Have Been a Big Story After Recessions
Some investors are already evaluating opportunities offered by a post-slowdown world. One of these opportunities is small-cap stocks, which have historically outperformed large caps, especially after recessions.
How Do Small Caps Fit into a Deglobalized World?
In response to deglobalization, multinational corporations are making changes to their logistics networks. Using MSCI Economic Exposure data, we examine how small-cap stocks around the world may be impacted.
A Sector Explanation for Small vs. Large Caps’ Emissions-Intensity Gap
The emissions intensity of the sectors that compose the small- and large-cap universes differs, helping to explain why small caps’ emissions intensity has exceeded that of their larger-cap peers.
The content of this page is for informational purposes only and is intended for institutional professionals with the analytical resources and tools necessary to interpret any performance information. Nothing herein is intended to recommend any product, tool or service. For all references to laws, rules or regulations, please note that the information is provided “as is” and does not constitute legal advice or any binding interpretation. Any approach to comply with regulatory or policy initiatives should be discussed with your own legal counsel and/or the relevant competent authority, as needed.