Higher Tariffs Ahead? Who’s Most at Risk
Key findings
- Global equity investors can attain a clearer picture of tariff-related risk by combining information on a firm’s revenue sources and manufacturing locations because both play crucial parts in the final risk tally.
- Analysis using MSCI Economic Exposure data shows that 18% of global corporate revenue faces tariff risk — notably from autos, capital goods, technology hardware and energy — some of which is already being priced in.
- Firms that export into the U.S. using production facilities in Canada, Mexico or China appear to face greater risk from new tariffs than non-U.S. firms that manufacture domestically.
As the Trump administration prepares to take office, investors and corporations are haunted by the growing specter of a global trade war. The announced intention is to impose comprehensive tariffs, at elevated rates, on U.S. imports from hitherto key trading partners such as Canada, Mexico and China.[1] A possible response by these and other nations may be retaliatory tariffs on U.S. exports. As investors review their portfolio strategies this year and beyond, a useful input in their decision making will be a well-rounded understanding of which firms and sectors could be most exposed to potential tariff-related changes.
U.S.-initiated tariffs have the potential to disrupt a significant portion of global commerce. Using MSCI Economic Exposure data, we analyzed corporations' revenue streams across the destination markets for their exports.[2] Just under 40% of global corporate revenue is earned in international markets, with 18% possibly at risk from proposed U.S. tariffs and potential countertariffs. Furthermore, the risk was evenly split between non-U.S. firms selling into the U.S. (8.4%) and U.S. firms selling internationally (9.7%).[3]
Potential tariffs threaten 18% of global corporate revenue
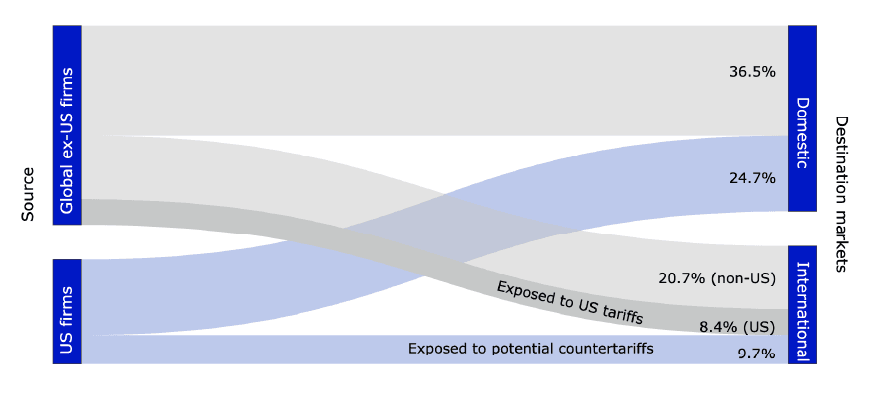
Data as of Nov. 29, 2024. Share of global corporate revenues between source and destination markets for the MSCI ACWI Investable Market Index (IMI) companies, calculated using MSCI Economic Exposure data.
Tariff risk by country and sector
Japan, Germany, U.K., China and Canada are the top five countries (by USD revenue) that sell into the U.S. market. Of these, Japanese, German and Korean automakers dominate automobiles and components imports, while Chinese, U.K. and Canadian firms lead in energy imports. Capital goods and materials also make up a substantial part of total U.S. imports but are more fragmented across exporting nations. Other industries, such as pharmaceuticals, food and beverages, and consumer durables, have represented a smaller portion of total U.S. imports but could be at risk due to their dependency on U.S. demand.
Global ex-US firms' US exposure highest in autos and components, capital goods and energy

Data as of Nov. 29, 2024. U.S. revenues of the MSCI ACWI ex US IMI companies grouped by GICS® industry groups and countries, based on MSCI Economic Exposure data. GICS is the global industry classification standard jointly developed by MSCI and S&P Global Market Intelligence.
Beyond revenue exposure, the location of a firm's production facilities may add another layer of risk. For instance, several Japanese automobile manufacturers produce vehicles in Mexico. Higher U.S. tariffs on Mexican imports could have a disproportionate impact on these firms compared to those that manufacture in Japan.
The following heatmap analysis combines MSCI Economic Exposure and MSCI GeoSpatial Asset Intelligence data to highlight the number of firms economically linked to the U.S. (defined as the source of more than 10% of their revenues) that have a production footprint in Canada, Mexico or China — all of which could be subject to higher tariffs.[4] Roughly 390 non-U.S. firms in our databases meet these criteria (of which 90 are Canadian, Mexican or Chinese firms).[5] Japanese firms appear the most exposed, with 91 at risk, including 28 in the capital-goods and 18 in the automobiles industries. Many European firms may also be at risk due to overlapping revenue dependencies and production locations.
Japanese and Chinese firms top list of those most exposed to higher US tariffs

Data as of Nov. 29, 2024. Count of the MSCI ACWI IMI ex-U.S. companies that have more than a 10% economic exposure to the U.S. and have manufacturing, industrial or production facilities in Canada, Mexico or China. Source: MSCI Economic Exposure and MSCI GeoSpatial Asset Intelligence
The market has already begun to discount certain industries ahead of potential new tariffs. For instance, in the months preceding and following the U.S. election, performance of the automobile and components industry has diverged across regions, declining in Europe, Japan and Korea and outperforming in the U.S. In contrast, in China — where auto exports to the U.S. are still limited — the effect has been muted.
Possible tariffs reflected in regional performance of automobiles and components industry

Data period from June 1, 2024, to Nov. 29, 2024. Performance of the automobiles and components/parts industry was calculated using regional equity-risk models: EFMUSALT for the U.S., EULT for Europe, JPNEFMLT for Japan, KRE3 for Korea and CXE1 for China. As of Nov. 29, 2024, Tesla Inc.'s weight in the EFMUSALT's factor portfolio for the automobiles and components industry was 37%.
The countertariff danger
If U.S. trading partners facing higher tariffs opt to impose their own tariffs on goods they import from the U.S., U.S. firms stand to suffer, as they collectively derive a quarter of their revenues from international markets. China, for example, was the largest end market of U.S. goods as of November 2024, with an export value to the U.S. more than double that of the U.K., the next-largest importing market. U.S. exports in technology, semiconductors, energy, capital goods and other industries are most immediately exposed to such potential retaliation. In practice, however, corporate supply chains can be extremely complex, and intermediate inputs may cross national and regional borders multiple times to reach final production.
Clearer insights by combining economic exposures and geospatial analysis
Tariff impacts on firms are more complicated than they may appear, influenced not only by where firms sell but where they operate. While non-U.S. corporations reliant on U.S. markets face significant risks, potential retaliatory measures could equally harm U.S. firms, especially those in export-dependent industries. Our analysis, using both economic-exposure and geospatial data, has helped narrow the focus to firms in certain regions engaged in specific industries.

Subscribe todayto have insights delivered to your inbox.
1 Trade between the U.S., Mexico and Canada, governed by the United States-Mexico-Canada Agreement (USMCA), has been in effect since July 1, 2020. The potential imposition by the U.S. of higher tariffs on Canada and Mexico could lead to import tax rates exceeding those outlined in the agreement.2 For more details, please refer to MSCI Economic Exposure Data Methodology.3 Approximately 32% of the MSCI ACWI IMI constituents' weight is exposed to tariff risk, which includes 6.5% from non-U.S. firms vulnerable to U.S. tariffs and 25.5% from U.S. firms at risk of potential countertariffs. We derived these percentages using the constituents' index-weighted average economic exposure.4 The MSCI GeoSpatial Asset Intelligence data contains information on physical assets owned or operated by public companies, including elements such as spatial and nonspatial attributes — for example, geographic coordinates — and types of activity carried out at the facility.5 As of Nov. 29, 2024, the 390 non-U.S. firms composed approximately 9% of the market-cap-weighted MSCI ACWI IMI, with an index-weighted economic exposure of 3%.
The content of this page is for informational purposes only and is intended for institutional professionals with the analytical resources and tools necessary to interpret any performance information. Nothing herein is intended to recommend any product, tool or service. For all references to laws, rules or regulations, please note that the information is provided “as is” and does not constitute legal advice or any binding interpretation. Any approach to comply with regulatory or policy initiatives should be discussed with your own legal counsel and/or the relevant competent authority, as needed.