Scenario Analysis: Equity Sell-Off
Key findings
- In Q3 2024, the combined weight of the information-technology (IT) and communication-services sectors exceeded 2000 levels, potentially posing a concentration risk for equity investors.
- We explore a potential sell-off scenario in which high-profitability stocks and companies with conservative investment practices would outperform, and the riskiest stocks underperform.
- In this scenario, global IT and consumer discretionary drop by 26% and 25%, respectively, and defensive sectors like consumer staples and health care fall by 3% and 13%, respectively, versus the broad market’s 19% decline.
Although the global IT and communication-services sectors posted strong gains in the first half of the year, they lagged the broad market in the third quarter.[1] And as equity investors continue to scrutinize technology companies, and notably AI, falling cyclical chip demand and mixed earnings signals could hint at vulnerabilities in some tech stocks' high valuations.[2] Additionally, the return of inflationary pressures and increased fiscal deficits could lead to higher borrowing costs for firms in the U.S.
In this blog post, we explore the implications of a potential sell-off, where we hypothesize that less-risky, more-profitable firms with more-conservative investment practices prove more resilient than their competitors.
Heightened US concentration in IT and communications services
U.S. equity-market concentration has been a key theme in 2024. By the end of the third quarter of 2024, IT and communication services accounted for 40% of the U.S. equity market.[3] We found that these sectors were the most concentrated and experienced the largest sell-offs during the dot-com bubble. Compared to 2000, today the combined weight of these sectors in regions such as Europe, Japan and the emerging markets is lower.
US IT and communication-services concentration surpassed 2000 levels
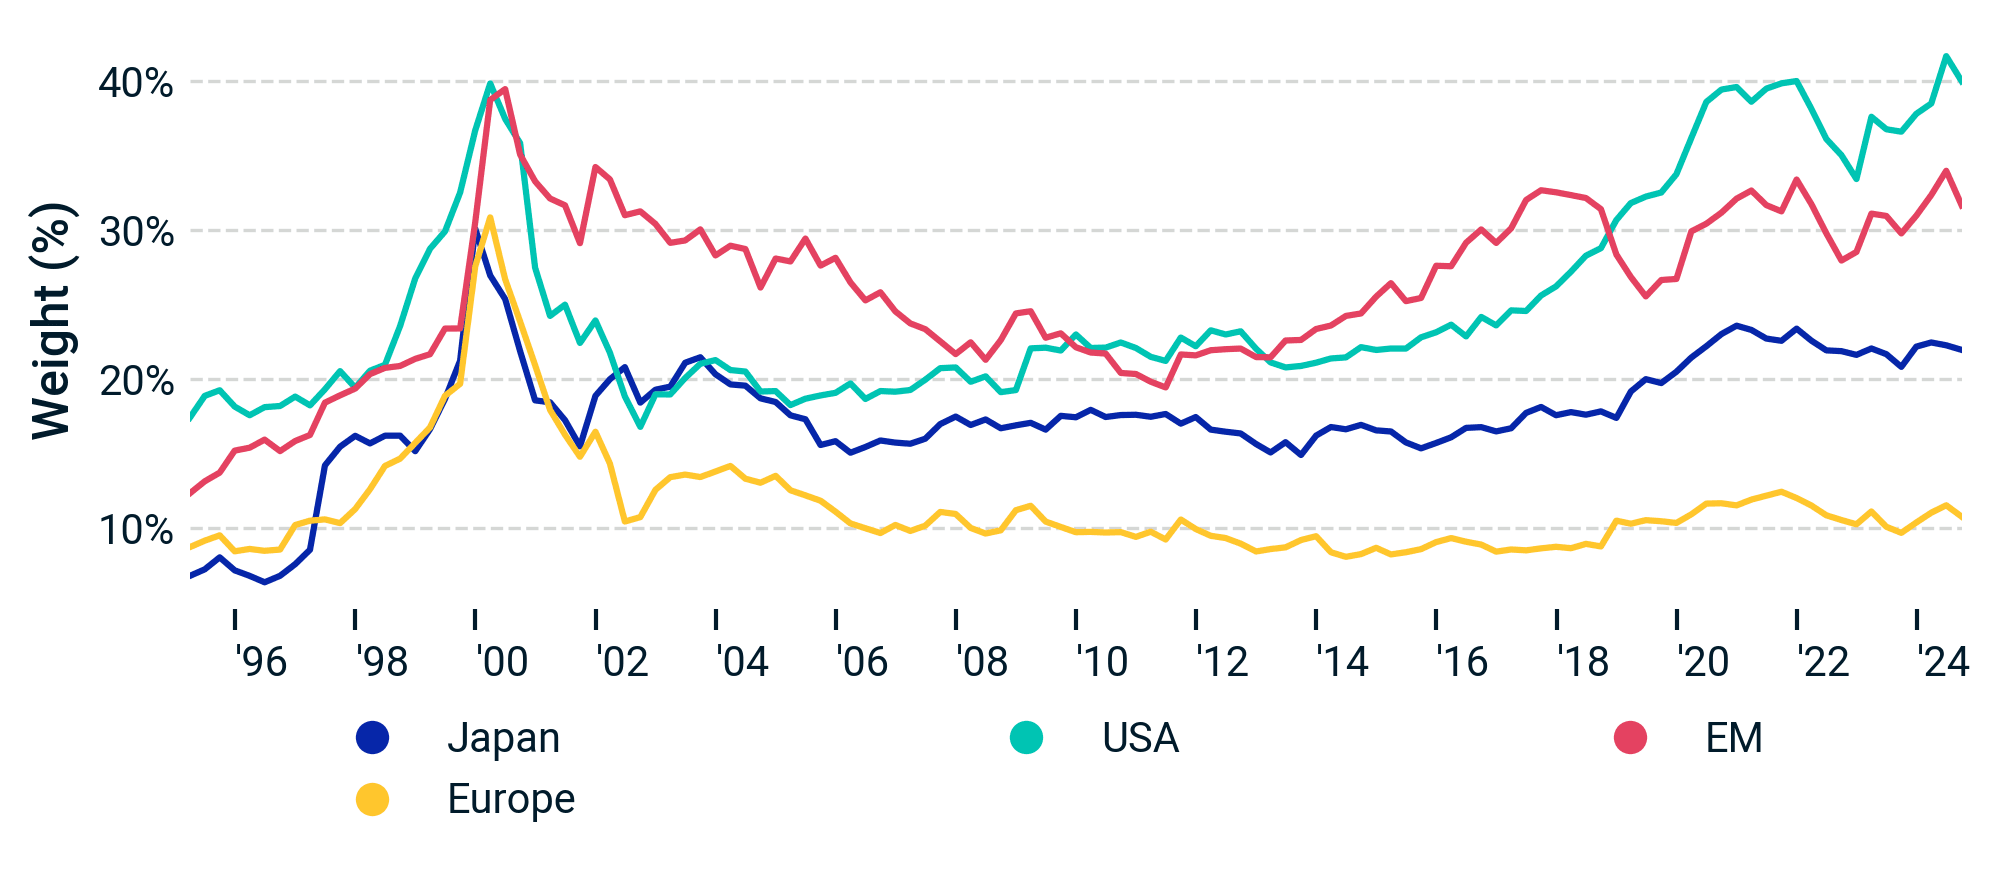
Evolution of the combined weight of communication services and IT in the MSCI regional indexes, from Jan. 1, 1995, to Sept. 30, 2024.
We compare the exposures of the 10 largest stocks relative to the other stocks in the MSCI USA Index. Today's leaders, although more profitable, are more momentum-driven and growth-oriented and have higher residual volatility and lower investment quality than the dot-com era's leaders.
Top 10 stocks are more profitable, but also more volatile than those in 2000
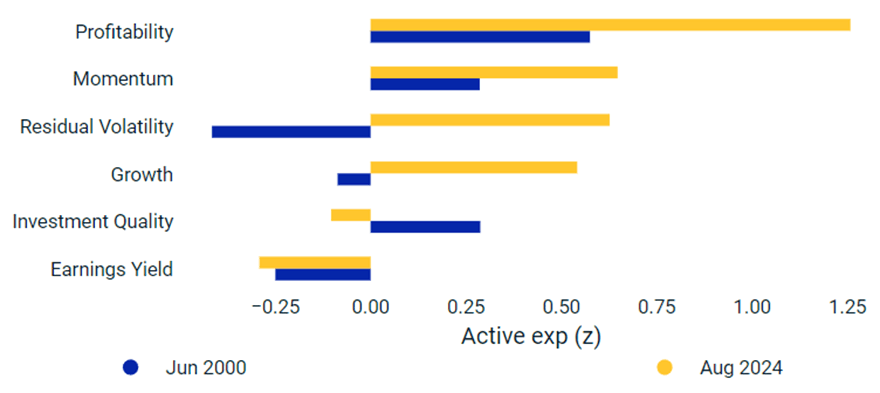
Mean exposures of the 10 largest holdings in the MSCI USA Investable Market Index relative to the rest of the index, excluding the 10 largest holdings. As of March 31, 2000, and Oct. 31, 2024.
A sell-off scenario for the equity market
It's plausible that high-margin firms could better weather a diminishing appetite for growth stocks. We therefore assume high-profitability stocks and companies with conservative investment practices outperform, while the riskiest stocks (as measured by their exposure to the residual-volatility factor) see steeper declines than the broad market.[4] To express this view, we assumed a three-sigma shock to the profitability, investment-quality and residual-volatility factors.[5] These three style shocks, in combination with current correlations, imply a broad equity-market drop of 19% — aligned with the average historical loss in past U.S. drawdowns driven by fundamentals.[6]
Portfolio implications
To assess the impact of this scenario on global equity sectors, industries and styles, we apply MSCI's predictive stress-testing framework to the MSCI ACWI Index.[7] In our scenario, global stocks lose 19%, a smaller drop than that of the top 10 stocks by market capitalization, which jointly fall by 25%. Global IT stocks register the largest loss relative to the MSCI ACWI Index (-7%), led by semiconductors (which underperform by 15%).
Consumer-discretionary stocks underperform the broad market by 5%, primarily driven by the auto industry, with a 28% underperformance. In contrast, defensive sectors, such as consumer staples, energy and health care, fare better, outperforming the broad market by 15%, 14% and 5%, respectively.
Cyclical sectors lead losses, while defensive stocks outperform broad market
Loading chart...
Please wait.
Portfolio impact of the scenario based on market data as of Nov. 25, 2024. Global style, sector and top- and bottom-five industry performance is measured relative to the MSCI ACWI Index.
How factor dislocations impact equity markets
In this blog post, we have analyzed the consequences of a stress-test scenario involving a narrow factor dislocation and explored how it propagates through sectors, style factors and the overall global equity market using the MSCI Multi-Asset Class Model. Sectors such as IT and consumer discretionary are more significantly impacted, while sectors like health care and consumer staples experience less pronounced losses. This differentiation presents opportunities for implementing mitigation strategies under such scenarios.


Subscribe todayto have insights delivered to your inbox.
1 We used the Global Industry Classification Standard (GICS®) for sector categorization. GICS is the industry-classification standard jointly developed by MSCI and S&P Global Market Intelligence.2 Richard Waters, “The tech sector should brace for further turbulence,” Financial Times, Oct. 17, 2024.3 Before the creation of the communication-services sector in 2018, it was represented by the telecommunication-services sector on the first exhibit. During the 2018 GICS reclassification, the telecommunication-services sector was expanded and renamed communication services. This reclassification primarily impacted the combined weight of the IT and communication-services sectors by incorporating media companies from the consumer-discretionary sector.4 We shock the investment-quality, profitability and residual-volatility factors in the MSCI Multi-Asset Class Model (MAC.L GEMLT). These represent pure factor returns — net of other effects such as market and industry — and we shock them by one standard deviation as of Nov. 25, 2024.5 Scenario assumptions are informed by analysis of historical style-factor returns over U.S. drawdowns and judgment. This is not a forecast, but a hypothetical narrative of how the scenario could affect multi-asset-class portfolios.6 Fundamental events are characterized by revised earnings and changes in perceived value, such as in the face of earnings surprises or after a period of “irrational exuberance.” We identified seven U.S. market sell-offs since 1946 that were driven by fundamental events and registered the maximum drawdown, the time to bottom and the time to recovery. Based on our analysis, fundamental events typically reached their maximum drawdown from peak within six months.7 The results are generated by using model correlations to propagate shocks to the portfolios, using MSCI's BarraOne®. MSCI clients can access BarraOne files for these scenarios on the client-support site.
The content of this page is for informational purposes only and is intended for institutional professionals with the analytical resources and tools necessary to interpret any performance information. Nothing herein is intended to recommend any product, tool or service. For all references to laws, rules or regulations, please note that the information is provided “as is” and does not constitute legal advice or any binding interpretation. Any approach to comply with regulatory or policy initiatives should be discussed with your own legal counsel and/or the relevant competent authority, as needed.