Hunting a COVID-19 factor
- We observed severe and diverse impacts in equity markets over our study period that suggest one could think of COVID-19 as a "factor."
- Our three methods to identify a COVID-19 factor produced one that is a linear combination of existing style and industry factors and formulated so that companies with high exposure to it may outperform under COVID-19.
- The methods generally showed that the COVID-19 factor had positive exposure to the health care, consumer staples, size and profitability factors, and negative exposure to airlines, consumer services, leverage and beta factors.
- Cumulative factor returns — We calculate each factor's cumulative return over the period from Feb. 24 through March 23 and that becomes the relative weight in our COVID-19 factor.1
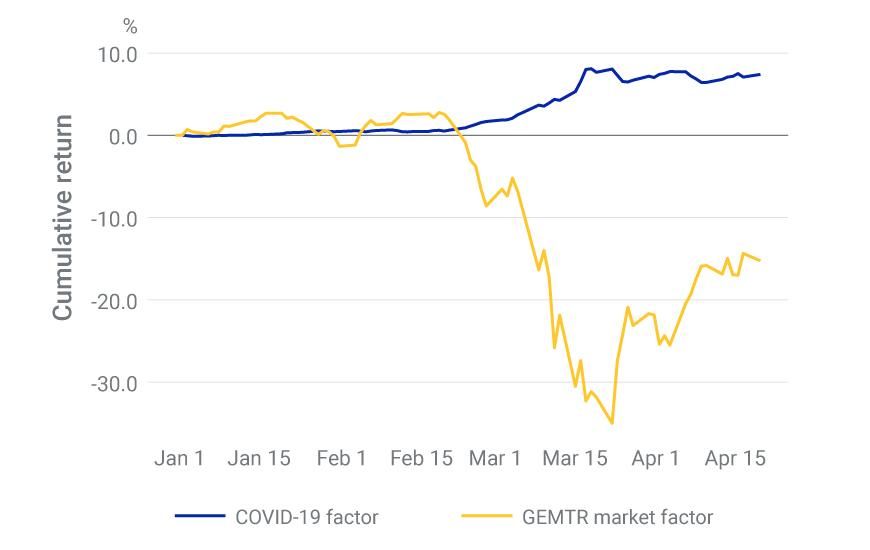
- Sensitivity to the market — We regress each factor's return against the market (world factor) return for the period from Feb. 24 through April 20, and the negative of the resulting slope coefficient becomes the relative weight in our COVID-19 factor.2
- Principal Component Analysis (PCA) on factor returns — We run PCA on factor returns and the first principal component becomes our COVID-19 factor, again using the period from Feb. 24 through April 20.
Factor | Weight | Unnamed: 2 | Factor.1 | Weight.1 |
|---|---|---|---|---|
Factor Food and staples retailing | Weight 4.57% | Unnamed: 2 None | Factor.1 Leverage | Weight.1 -5.93% |
Factor Short interest | Weight 4.22% | Unnamed: 2 None | Factor.1 Consumer service | Weight.1 -4.02% |
Factor Industry momentum | Weight 4.00% | Unnamed: 2 None | Factor.1 Dividend yield | Weight.1 -3.65% |
Factor Profitability | Weight 3.01% | Unnamed: 2 None | Factor.1 Airlines | Weight.1 -3.08% |
Factor Size | Weight 2.61% | Unnamed: 2 None | Factor.1 Consumer durables and apparel | Weight.1 -3.05% |
Factor Biotechnology | Weight 1.88% | Unnamed: 2 None | Factor.1 Diversified financials | Weight.1 -2.93% |
Factor Telecommunication services | Weight 1.84% | Unnamed: 2 None | Factor.1 Real estate | Weight.1 -2.63% |
Factor Food and beverage and tobacco | Weight 1.80% | Unnamed: 2 None | Factor.1 Commercial and professional services | Weight.1 -2.56% |
Factor Household and personal products | Weight 1.72% | Unnamed: 2 None | Factor.1 Liquidity | Weight.1 -2.53% |
Factor Pharmaceuticals and life sciences | Weight 1.40% | Unnamed: 2 None | Factor.1 Aerospace and defense | Weight.1 -2.47% |
Factor Steel | Weight 1.32% | Unnamed: 2 None | Factor.1 Beta | Weight.1 -2.06% |
Factor Semiconductors | Weight 1.23% | Unnamed: 2 None | Factor.1 Energy equipment and services | Weight.1 -1.94% |
Factor Communications equipment | Weight 1.20% | Unnamed: 2 None | Factor.1 Insurance | Weight.1 -1.89% |
Factor Transportation non-airline | Weight 0.90% | Unnamed: 2 None | Factor.1 Thrifts and mortgage finance | Weight.1 -1.86% |
Factor IT services and software | Weight 0.77% | Unnamed: 2 None | Factor.1 Residual volatility | Weight.1 -1.70% |
Factor | Weight | Unnamed: 2 | Factor.1 | Weight.1 |
|---|---|---|---|---|
Factor Profitability | Weight 3.43% | Unnamed: 2 None | Factor.1 Beta | Weight.1 -7.53% |
Factor Food and staples retailing | Weight 3.16% | Unnamed: 2 None | Factor.1 Short-term reversal | Weight.1 -5.94% |
Factor Short interest | Weight 2.21% | Unnamed: 2 None | Factor.1 Leverage | Weight.1 -4.04% |
Factor Pharmaceuticals and life sciences | Weight 2.05% | Unnamed: 2 None | Factor.1 Real estate | Weight.1 -3.89% |
Factor Media | Weight 1.97% | Unnamed: 2 None | Factor.1 Liquidity | Weight.1 -3.42% |
Factor Food and beverage and tobacco | Weight 1.83% | Unnamed: 2 None | Factor.1 Residual volatility | Weight.1 -3.41% |
Factor Health care equipment and suppliers | Weight 1.79% | Unnamed: 2 None | Factor.1 Insurance | Weight.1 -3.30% |
Factor Mid capitalization | Weight 1.55% | Unnamed: 2 None | Factor.1 Diversified financials | Weight.1 -3.26% |
Factor Biotechnology | Weight 1.49% | Unnamed: 2 None | Factor.1 Consumer services | Weight.1 -2.95% |
Factor Long-term reversal | Weight 1.42% | Unnamed: 2 None | Factor.1 Capital markets | Weight.1 -2.78% |
Factor Earnings variability | Weight 1.34% | Unnamed: 2 None | Factor.1 Utilities | Weight.1 -2.39% |
Factor Household and personal products | Weight 1.33% | Unnamed: 2 None | Factor.1 Thrifts and mortgage finance | Weight.1 -2.27% |
Factor Growth | Weight 1.32% | Unnamed: 2 None | Factor.1 Regional banks | Weight.1 -2.06% |
Factor IT services and software | Weight 1.17% | Unnamed: 2 None | Factor.1 Retailing | Weight.1 -1.61% |
Factor Book-to-price | Weight 1.08% | Unnamed: 2 None | Factor.1 Consumer durables and apparel | Weight.1 -1.53% |
Factor | Weight | Unnamed: 2 | Factor.1 | Weight.1 |
|---|---|---|---|---|
Factor Short interest | Weight 3.74% | Unnamed: 2 None | Factor.1 Short-term reversal | Weight.1 -7.01% |
Factor Food and staples retailing | Weight 3.54% | Unnamed: 2 None | Factor.1 Consumer services | Weight.1 -5.78% |
Factor Industry momentum | Weight 3.03% | Unnamed: 2 None | Factor.1 Beta | Weight.1 -5.08% |
Factor Profitability | Weight 2.38% | Unnamed: 2 None | Factor.1 Real estate | Weight.1 -3.98% |
Factor Size | Weight 2.00% | Unnamed: 2 None | Factor.1 Leverage | Weight.1 -3.89% |
Factor Utilities | Weight 1.74% | Unnamed: 2 None | Factor.1 Diversified financials | Weight.1 -3.83% |
Factor Long-term reversal | Weight 1.40% | Unnamed: 2 None | Factor.1 Airlines | Weight.1 -3.38% |
Factor Food and beverage and tobacco | Weight 1.39% | Unnamed: 2 None | Factor.1 Consumer durables and apparel | Weight.1 -3.03% |
Factor Household and personal products | Weight 1.39% | Unnamed: 2 None | Factor.1 Retailing | Weight.1 -2.66% |
Factor Steel | Weight 1.30% | Unnamed: 2 None | Factor.1 Aerospace and defense | Weight.1 -2.53% |
Factor Biotechnology | Weight 1.19% | Unnamed: 2 None | Factor.1 Dividend yield | Weight.1 -2.30% |
Factor Gold | Weight 1.11% | Unnamed: 2 None | Factor.1 Automobiles and components | Weight.1 -2.13% |
Factor Regional banks | Weight 1.09% | Unnamed: 2 None | Factor.1 Earnings yield | Weight.1 -1.93% |
Factor Telecommunication services | Weight 1.01% | Unnamed: 2 None | Factor.1 Analyst sentiment | Weight.1 -1.87% |
Factor Pharmaceuticals and life sciences | Weight 0.92% | Unnamed: 2 None | Factor.1 Thrifts and mortgage finance | Weight.1 -1.63% |
Factor | Weight | Unnamed: 2 | Factor.1 | Weight.1 |
|---|---|---|---|---|
Factor Food and staples retailing | Weight 4.06% | Unnamed: 2 None | Factor.1 Beta | Weight.1 -5.29% |
Factor Short interest | Weight 3.67% | Unnamed: 2 None | Factor.1 Short-term reversal | Weight.1 -5.06% |
Factor Profitability | Weight 3.18% | Unnamed: 2 None | Factor.1 Leverage | Weight.1 -5.00% |
Factor Industry momentum | Weight 2.83% | Unnamed: 2 None | Factor.1 Consumer services | Weight.1 -4.60% |
Factor Food and beverage and tobacco | Weight 1.81% | Unnamed: 2 None | Factor.1 Real estate | Weight.1 -3.79% |
Factor Size | Weight 1.81% | Unnamed: 2 None | Factor.1 Diversified financials | Weight.1 -3.62% |
Factor Biotechnology | Weight 1.64% | Unnamed: 2 None | Factor.1 Consumer durables and apparel | Weight.1 -2.75% |
Factor Household and personal products | Weight 1.61% | Unnamed: 2 None | Factor.1 Airlines | Weight.1 -2.57% |
Factor Pharmaceuticals and life sciences | Weight 1.58% | Unnamed: 2 None | Factor.1 Residual volatility | Weight.1 -2.43% |
Factor Telecommunication services | Weight 1.37% | Unnamed: 2 None | Factor.1 Dividend yield | Weight.1 -2.39% |
Factor Steel | Weight 1.14% | Unnamed: 2 None | Factor.1 Liquidity | Weight.1 -2.39% |
Factor Communications equipment | Weight 0.97% | Unnamed: 2 None | Factor.1 Aerospace and defense | Weight.1 -2.34% |
Factor IT services and software | Weight 0.92% | Unnamed: 2 None | Factor.1 Insurance | Weight.1 -2.34% |
Factor Semiconductors | Weight 0.92% | Unnamed: 2 None | Factor.1 Retailing | Weight.1 -2.09% |
Factor Gold | Weight 0.82% | Unnamed: 2 None | Factor.1 Thrifts and mortgage finance | Weight.1 -2.08% |
Unnamed: 0 | Feb. 24, 2020 | April 20, 2020 |
|---|---|---|
Unnamed: 0 MSCI ACWI Consumer Discretionary Index | Feb. 24, 2020 -0.16 | April 20, 2020 0.06 |
Unnamed: 0 MSCI ACWI Diversified Multiple-Factor Index | Feb. 24, 2020 0.21 | April 20, 2020 0.09 |
Unnamed: 0 MSCI ACWI Momentum Index | Feb. 24, 2020 0.4 | April 20, 2020 0.09 |
Unnamed: 0 MSCI ACWI Quality Index | Feb. 24, 2020 0.48 | April 20, 2020 0.4 |
Unnamed: 0 MSCI ACWI Minimum Volatility (USD) Index | Feb. 24, 2020 0.5 | April 20, 2020 0.1 |
Unnamed: 0 MSCI ACWI Consumer Staples Index | Feb. 24, 2020 0.85 | April 20, 2020 0.62 |

Subscribe todayto have insights delivered to your inbox.
The content of this page is for informational purposes only and is intended for institutional professionals with the analytical resources and tools necessary to interpret any performance information. Nothing herein is intended to recommend any product, tool or service. For all references to laws, rules or regulations, please note that the information is provided “as is” and does not constitute legal advice or any binding interpretation. Any approach to comply with regulatory or policy initiatives should be discussed with your own legal counsel and/or the relevant competent authority, as needed.