Markets in Focus: Narrow Yield Spread and High Crowding Pressure Equities
Key findings
- A historically narrow U.S. equity/bond yield spread could tempt asset allocators to shift exposure away from U.S. equities, opening the door to rising equity-market volatility.
- Our research shows the combination of low quality and high crowding has been bad for a stock’s performance. We look at the crowding score and quality exposure for a subset of stocks in each sector across the regional markets.
- The MSCIAdaptiveMulti-Factor Allocation Model highlightedan overweight to value, low-volatility and low size, as of Sept. 30, 2023.
In the third quarter of 2023, the MSCI ACWI Index was down 3.3%, as the persistence of recessionary fears alongside surging oil prices and elevated interest rates suppressed investor optimism. U.S. Treasurys had negative returns, with a 3.4% loss for the MSCI USD Government Bond Index over the last quarter as interest rates moved higher. Although equities were negative for the quarter, the MSCI ACWI Index was up 10.5% year to date. Because rising valuations have largely driven the equity market's strong performance this year, investors have begun to watch for crowding in hot stocks and the potential for higher volatility. In this blog post, we compare equity-earnings and fixed-income yields within the context of their historical relationship and highlight high (low) crowding in low- (high-) quality stocks across regions and sectors.
Low equity/bond yield spread may tempt asset allocators to lower equity exposure
Real bond yields in the U.S., U.K. and eurozone remained substantially above their 10-year averages at quarter-end, and YTD returns in the government and investment-grade corporate sectors were below the rate of inflation.
In the interactive exhibit below, we show the spread between 12-month forward equity-earnings yields and 10-year real bond yields as a measure of relative value. In the U.S., bond yields had been lower than equity yields, but the spread has narrowed and is now significantly below the historical average. In other words, by this measure of relative value, U.S. bond-market valuations look low relative to equity valuations. In contrast, the relationship between bond and equity yields in regions other than the U.S. was close to the historical average.
U.S. bonds' higher yields could tempt allocators to shift some exposure from equities to bonds. Before doing so, they may want to consider potential risks, including unexpected higher inflation and growing U.S. budget deficits.
The spread between US equity and bond yields is below its historical average
Loading chart...
Please wait.
The yield spread for the U.S. is the MSCI USA Index 12-month forward earnings yield minus the 10-year U.S. Treasury's real yield. The yield spread for the eurozone is the MSCI EMU Index 12-month forward earnings yield minus the 10-year German bund's real yield. The yield spread for the U.K. is the MSCI UK Index 12-month forward earnings yield minus the 10-year U.K. gilt's real yield. The yield spread for Japan is the MSCI Japan Index 12-month forward earnings yield minus the 10-year Japan government bond's real yield. Data is from January 2006 through September 2023.
Does the market need stock-level crowd and quality control?
High concentration in the strong YTD performance of global equities has raised the specter of crowding risk — many investors' chasing a narrow set of securities within the broad universe.
We can use the MSCI Security Crowding Model, which provides a crowding score for individual securities based on various time-series and cross-sectional metrics, to analyze the relationship of crowding, quality and performance. Looking back to 1995, we found that a portfolio of the most-crowded stocks (decile 10, blue bar) underperformed, on average, but the underperformance was magnified when the portfolio held the lowest-quality stocks (decile 10, yellow bar). In contrast, a portfolio of stocks with the lowest crowding scores and highest-quality exposure (decile 1, yellow bar) outperformed a portfolio of stocks based solely on a low crowding score (decile 1, blue bar).
High crowding and low quality have been a losing performance combination

The universe is composed of the constituents of the MSCI World Index. The blue bars represent deciles based on each index constituent's crowding score as determined by the MSCI Security Crowding Model. The yellow bars represent deciles based on the average of the constituent's crowding score and exposure to the quality factor. Portfolios are equally weighted and rebalanced monthly. Data is from January 1995 through September 2023.
The following exhibit lists the top eight and bottom eight securities in each sector across regions. The quadrant analysis combines each stock's crowding score and quality exposure in each sector and region. In general, stocks in the top-left quadrant (negative quality exposure and high crowding score) provide investors more reasons for caution.
Regional snapshots of securities' crowding scores and quality exposures
Loading chart...
Please wait.
As of Sept. 30, 2023. The regions are represented by the MSCI AC Asia ex Japan Index, MSCI ACWI Index, MSCI Emerging Markets Index, MSCI Europe Index, MSCI Japan Index, MSCI USA Index and MSCI World Index. Gross returns are in USD.
India was the only positive among the top developed- and emerging-market countries
The MSCI broad-market indexes were down across all regions and major countries, with India being the only exception. Among the factor indexes, the MSCI Value, Yield and Low Volatility Indexes outperformed in most regions. The climate, ESG and thematic indexes posted flat to negative returns across almost all regions.
Value, low-volatility and yield indexes led in most regions in Q3 2023
Loading chart...
Please wait.
The table shows regional variations of market-cap and non-market-cap MSCI indexes from June 30, 2022, to Sept. 30, 2023. The bar chart shows the active returns of the same indexes, by region, for each month in the quarter as well as for the full quarter. The indexes are the MSCI ACWI Index, MSCI World Index, MSCI World ex USA Index, MSCI Emerging Markets Index, MSCI USA Index, MSCI Europe Index, MSCI AC Asia ex Japan Index and MSCI Japan Index.
What the MSCI Adaptive Multi-Factor Allocation Model indicates
Our adaptive multi-factor framework is a model designed to analyze factor-based decisions. Our research suggests the value in taking a holistic approach to factor assessment. This approach encompasses the macroeconomic environment, as discussed above, as well as factor valuations, recent performance trends and risk sentiment.
As of Sept. 30, the MSCI Adaptive Multi-Factor Allocation Model showed an overweight to value and a slight overweight to low volatility, relative to an equally weighted factor mix, as shown below.
Exposures from MSCI Adaptive Multi-Factor Allocation Model
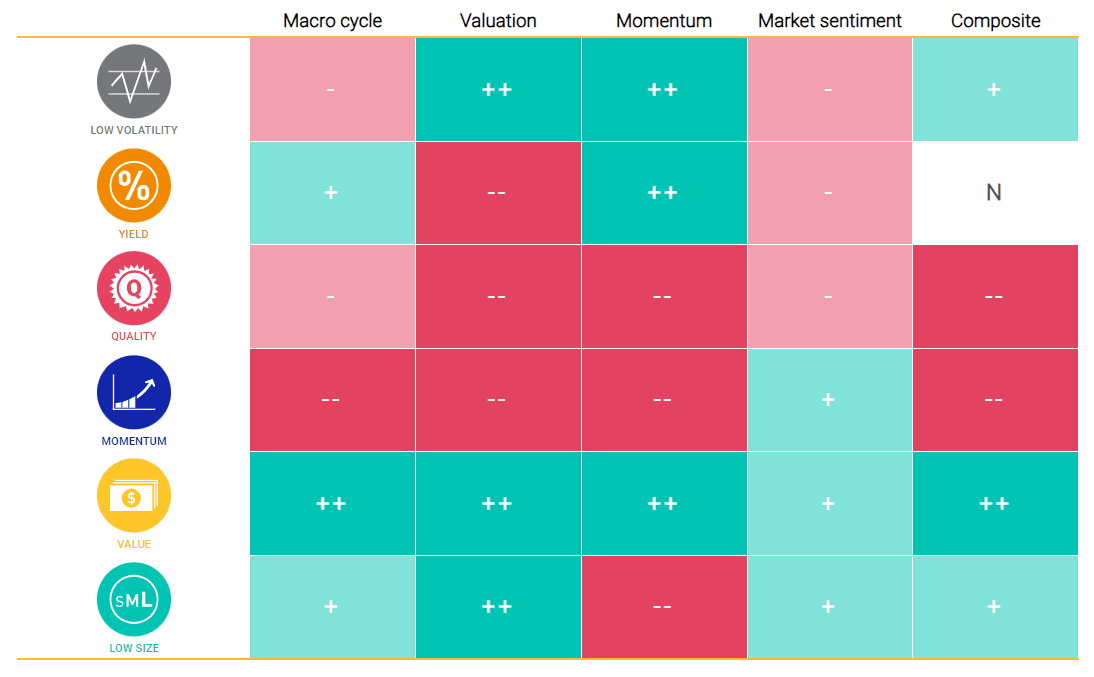
Data as of Sept. 30, 2023. Positive exposures are denoted as + or ++, negative as - or -- and neutral as N.


Subscribe todayto have insights delivered to your inbox.
The content of this page is for informational purposes only and is intended for institutional professionals with the analytical resources and tools necessary to interpret any performance information. Nothing herein is intended to recommend any product, tool or service. For all references to laws, rules or regulations, please note that the information is provided “as is” and does not constitute legal advice or any binding interpretation. Any approach to comply with regulatory or policy initiatives should be discussed with your own legal counsel and/or the relevant competent authority, as needed.