Low Volatility Today. Concern or Opportunity for Tomorrow?
Volatility in global equity markets has been low in 2023, following a period of higher volatility in 2022. Daily returns of the MSCI World Index have remained in a range of +/- 2% over the last 182 trading days through Sept. 19, 2023. The last time the market posted an uninterrupted streak of similarly narrow returns of this duration was in 2017.
Are the U.S. capital markets signaling an about face in equity volatility?
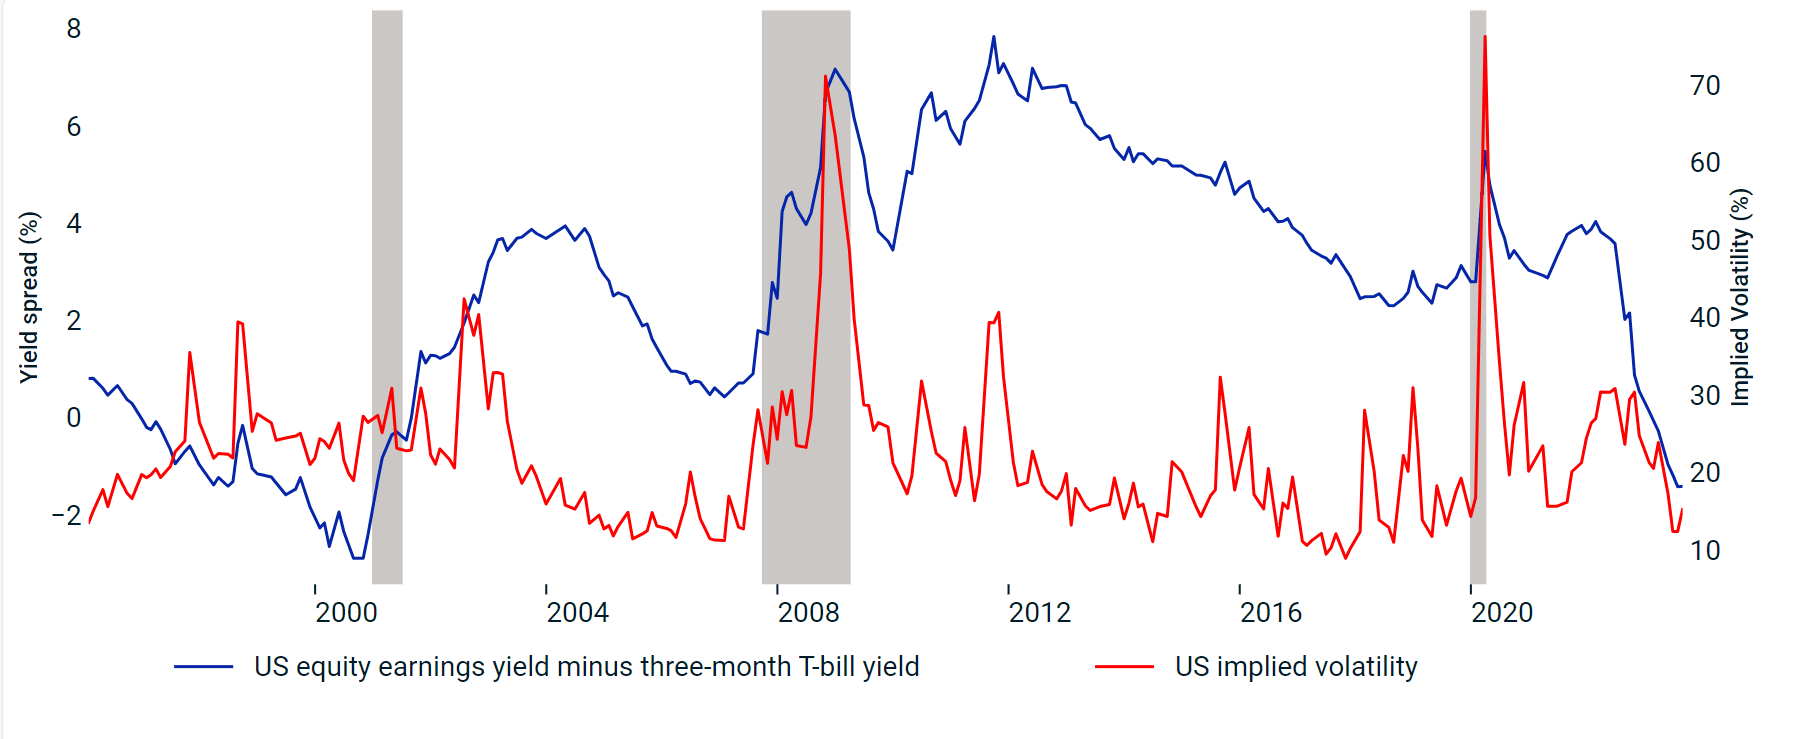
We compared the spread between the three-month U.S. Treasury bill yield and the earnings yield of the U.S. equity market from January 1996 through August 2023. Over this nearly 25-year period, a sharp contraction in the spread between the two yields was often followed by a recession and a spike in equity volatility. The spread has dropped markedly over the last several months.
Cost to insure against higher volatility appears low
Some institutional investors choose to hedge their downside exposure to market moves by using put options. For investors who may be concerned about the potential of rising volatility and a decline in equities, what is the cost today of insuring against that risk?
Looking back over the last five years, we found that options' implied volatility linked to the MSCI EAFE, MSCI Emerging Markets and S&P 500 Indexes was within the 20th percentile as of Sept. 15, 2023. Additionally, the options markets had low skew based on the put-to-call spread and a low implied probability of severe drawdowns. As a result of the low-vol trend in 2023, the cost of a three-month 95% put option on the MSCI Emerging Markets Index was 1.9% of spot on Aug. 31, 2023, compared to 3.0% of spot on Dec. 30, 2022. The cost of hedging downside exposure today has fallen substantially versus eight months ago.
Past volatility spikes were preceded by a sharp contraction in the equity/T-bill yield spread
Option premiums, like global equity volatility, have trended lower around the world
Loading chart...
Please wait.
Data is from Sept. 01, 2018, to Sept. 15, 2023. Implied volatility is based on the average implied volatility of 30-day at-the-money call and put options. The implied-volatility skew is calculated using the five-day moving average of the put-call implied-volatility spread of the 91-day 20-delta strikes. Options linked to the MSCI EAFE, MSCI Emerging Markets and S&P 500 Indexes were used to calculate the implied volatility and skew for the EAFE, emerging-markets and U.S. regions, respectively. Source: OptionMetrics


Subscribe todayto have insights delivered to your inbox.
Global market trends and the Magnificent 7
Global equity markets bounced back strongly this year. However, the market returns have been driven by “Magnificent 7" ” and the rise of artificial intelligence.
Nearshoring, Friendshoring and Reshoring: Heads Up to Equity Allocators
Multinational corporations’ recent interest in reconfiguring their global supply chains and adopting “China-plus” manufacturing strategies has potential consequences for equity allocators, reaching across countries, sectors and themes.
Underperforming Growth Managers Showed Skill
Over the last several years, most active growth managers underweighted the “Magnificent Seven.” Nearly two-thirds of growth managers, however, partially or more than offset the resulting performance drag with active bets on other stocks.
The content of this page is for informational purposes only and is intended for institutional professionals with the analytical resources and tools necessary to interpret any performance information. Nothing herein is intended to recommend any product, tool or service. For all references to laws, rules or regulations, please note that the information is provided “as is” and does not constitute legal advice or any binding interpretation. Any approach to comply with regulatory or policy initiatives should be discussed with your own legal counsel and/or the relevant competent authority, as needed.