More than a feeling: Quantifying consumer sentiment

Blog post
July 17, 2019
  • Among a flood of alternative data sources, consumer sentiment based on online citations stood out as adding explanatory power in the cross-section of returns.
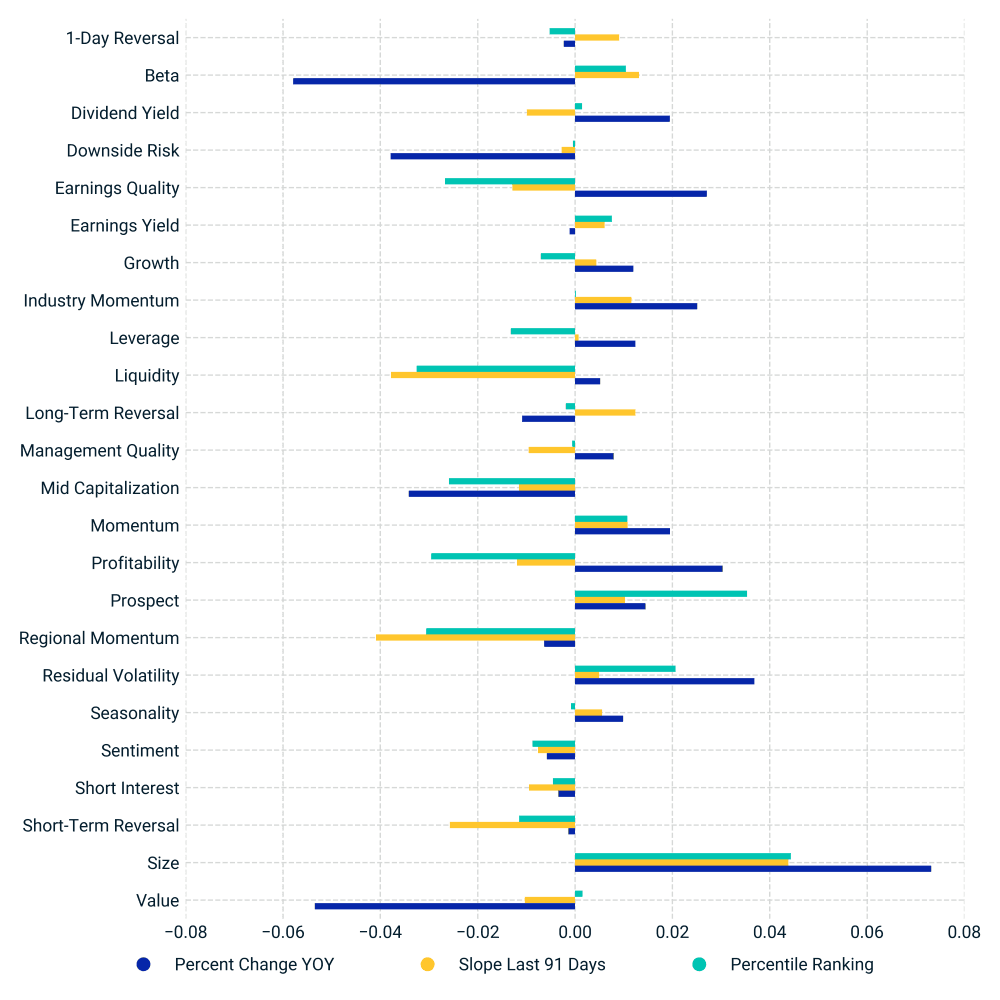
  • The consumer sentiment signals examined had little correlation with traditional style-factor exposures.
  • Individual metrics and the equal-weighted combination had positive factor and quintile spread returns and positive information ratios.
As factor investing and technology have evolved, investors have been inundated with alternative data, much of it coming with great claims of adding value to the investment process. Among the many alternative data sources we have examined, data on consumer sentiment stood out as a diverse and potentially powerful metric beyond traditional factors.1
Spotlight on consumer sentiment
We analyzed a number of consumer-sentiment metrics based on changes in "web luminosity" (the number of citations a company receives on its products and brands in reviews, social media and other web content) and its relationship with that company's fundamentals and stock performance. For this analysis we used BrandLoyalties' "as-published" data, which begins in 2012.2 As of Dec. 31, 2018, the data covered over 1,500 global companies with approximately 1,100 in the MSCI ACWI IMI universe and close to 1,000 in the MSCI USA IMI. Sectors with more visibility among consumers, such as consumer discretionary, consumer staples and technology had higher coverage than those with less consumer presence, such as energy and utilities. Because the sample is dominated by U.S. companies, we used the MSCI Barra US Total Market Equity Trading Model (USFAST) for our analysis and restricted our sample to the MSCI USA IMI universe.
Coverage of BrandLoyalties data in MSCI indexes
Consumer sentiment factors were largely uncorrelated to traditional factors
To test how independent these consumer-sentiment metrics were, we calculated their cross-sectional correlation with the style-factor exposures of USFAST and with each other. In the exhibit below, we see that most of the correlations, including those with other sentiment measures, such as analyst sentiment (earnings estimate revisions) and short interest, were near zero.
Correlations of consumer sentiment metrics3 with each other and USFAST style factors
Signal
Percent Change YOY
Slope Last 91 Days
Percentile Ranking
Signal

Percent Change YOY

Percent Change YOY

1.0

Slope Last 91 Days

None

Percentile Ranking

None

Signal

Slope Last 91 Days

Percent Change YOY

0.28

Slope Last 91 Days

1.0

Percentile Ranking

None

Signal

Percentile Ranking

Percent Change YOY

0.21

Slope Last 91 Days

0.65

Percentile Ranking

1.0

Average cross-sectional correlation of BrandLoyalties signals with USFAST style factors and with each other. Sample period is 2012-2018 in the MSCI USA IMI universe.
Looking beyond correlation
Of course, low correlation to existing factors does not guarantee a metric will add explanatory power on top of other factors. To assess marginal explanatory power in the cross-section of returns, we evaluated the performance of the consumer sentiment metrics in both univariate and multivariate frameworks. The multivariate results show the unique contribution of a given factor over and above those of all other factors – style, industry and market. In the exhibit below, we display performance statistics of the BrandLoyalties metrics as well as an equal-weighted combination of the metrics averaged over 2012 to 2018.
Averaged performance of consumer sentiment metrics
Unnamed: 0
Quintile Portfolio Statistics
Quintile Portfolio Statistics.1
Quintile Portfolio Statistics.2
Multivariate Regression Statistics
Multivariate Regression Statistics.1
Multivariate Regression Statistics.2
Multivariate Regression Statistics.3
Multivariate Regression Statistics.4
Stability
Unnamed: 0

Signal

Quintile Portfolio Statistics

Quintile Spread Return, %

Quintile Portfolio Statistics.1

Quintile Spread IR

Quintile Portfolio Statistics.2

Rank IC (%)

Multivariate Regression Statistics

Factor Return, %

Multivariate Regression Statistics.1

Factor Volatility, %

Multivariate Regression Statistics.2

Factor IR

Multivariate Regression Statistics.3

Mean |t|

Multivariate Regression Statistics.4

|t| > 2, %

Stability

Exposure auto-correlation

Unnamed: 0

Percent Change YOY

Quintile Portfolio Statistics

0.85%

Quintile Portfolio Statistics.1

0.16

Quintile Portfolio Statistics.2

1.57%

Multivariate Regression Statistics

0.75%

Multivariate Regression Statistics.1

1.17%

Multivariate Regression Statistics.2

0.64

Multivariate Regression Statistics.3

0.98

Multivariate Regression Statistics.4

11.26%

Stability

0.92

Unnamed: 0

Slope Last 91 Days

Quintile Portfolio Statistics

1.98%

Quintile Portfolio Statistics.1

0.5

Quintile Portfolio Statistics.2

0.81%

Multivariate Regression Statistics

0.61%

Multivariate Regression Statistics.1

1.02%

Multivariate Regression Statistics.2

0.6

Multivariate Regression Statistics.3

0.91

Multivariate Regression Statistics.4

10.99%

Stability

0.55

Unnamed: 0

Percentile Ranking

Quintile Portfolio Statistics

2.49%

Quintile Portfolio Statistics.1

0.67

Quintile Portfolio Statistics.2

0.64%

Multivariate Regression Statistics

0.36%

Multivariate Regression Statistics.1

0.99%

Multivariate Regression Statistics.2

0.36

Multivariate Regression Statistics.3

0.91

Multivariate Regression Statistics.4

7.97%

Stability

0.63

Unnamed: 0

Eq-Wt Combination

Quintile Portfolio Statistics

2.35%

Quintile Portfolio Statistics.1

0.59

Quintile Portfolio Statistics.2

1.19%

Multivariate Regression Statistics

0.68%

Multivariate Regression Statistics.1

1.05%

Multivariate Regression Statistics.2

0.65

Multivariate Regression Statistics.3

0.91

Multivariate Regression Statistics.4

8.79%

Stability

0.71

Data from 2012 to 2018. Quintile spreads are calculated as the difference in equal-weighted top- and bottom-quintile portfolio monthly returns. Rank ICs are defined as the rank correlation of the month-end signal exposures with security returns in the subsequent month. The multivariate statistics are the results of weekly cross-sectional regressions in USFAST. Stability is defined as month-to-month auto-correlation in exposure.
While the t-stats and volatilities were relatively low, all the individual metrics, as well as the equal-weighted combination had positive factor returns, quintile spread returns and information ratios. These characteristics are more typical of alpha associated factors than traditional risk factors such as size and beta. Stability was generally moderate, in the 0.50 to 0.90 range that we label medium-term factors. Further, the individual metrics and the combination factor generated positive quintile spreads and factor returns. Those results are shown in the exhibit below.
Cumulative factor returns of consumer sentiment metrics were positive over time
In all, our results indicated that online consumer-sentiment signals provided additional transparency into sources of risk and return and could be a valuable new factor.
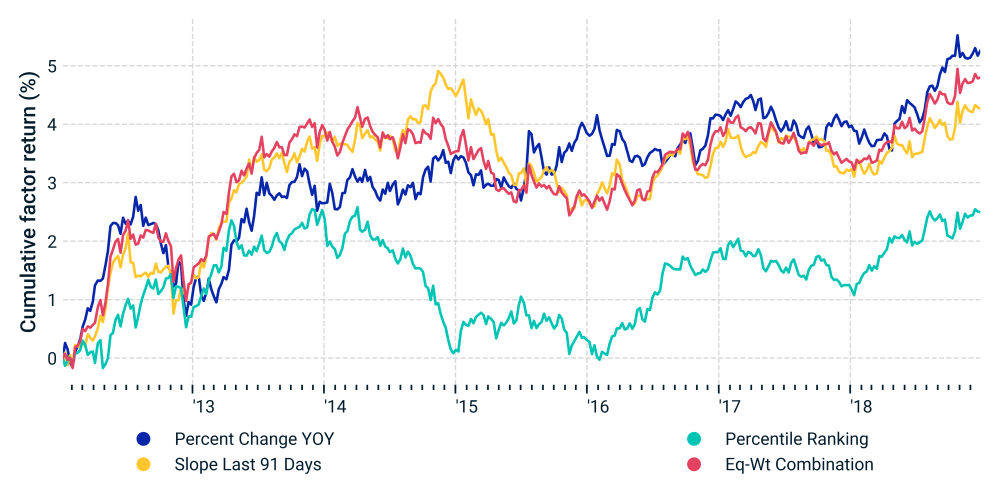
  1. Percent Change YOY: year-over-year percentage change (to two decimal places) in the daily number of web-based consumer brand citations, averaged over the trailing 91 calendar days.
  2. Slope Last 91 Days: regression slope of the year-over-year change in the number of web-based consumer brand citations over the last 91 calendar days.
  3. Percentile Ranking: the percentile ranking (0-100) of the citation share growth of the brand names for each company on that given day. Percentile ranking is among the entire BrandLoyalties universe, calculated via an algorithm that weights both YOY change and 91-day slope of citation share.
Further Reading

Subscribe today
to have insights delivered to your inbox.

1 Factors constructed from BrandLoyalties data are included in MSCI FactorLab.2 BrandLoyalties as-published data represent exactly the then-live data provided to their clients on any given historical day. BrandLoyalties also maintains a bi-temporal pro-forma data set, which starts in 2006, that back fills history of their full-coverage universe as of a given date. The back filled pro-forma data also restates the historical metrics using the latest available mix of brand information and corporate actions.3 We evaluated three BrandLoyalties as-published metrics

The content of this page is for informational purposes only and is intended for institutional professionals with the analytical resources and tools necessary to interpret any performance information. Nothing herein is intended to recommend any product, tool or service. For all references to laws, rules or regulations, please note that the information is provided “as is” and does not constitute legal advice or any binding interpretation. Any approach to comply with regulatory or policy initiatives should be discussed with your own legal counsel and/or the relevant competent authority, as needed.