Nowhere to Hide? Opportunities for Multi Asset Portfolios Amid the Tariff Mayhem
Key findings
- President Trump’s tariff announcement on April 2 sent shockwaves through global markets. Investors witnessed extreme volatility across equities, bonds, currencies, commodities and digital assets.
- We dissect market performance and assess the outlook for multi-asset class (MAC) portfolios under different scenarios. A typical MAC portfolio could suffer a decline of 5.5% in a recession scenario and 9.4% in a stagflation scenario.
- Previous crises provide guidance for seeking opportunities and managing risk in MAC portfolios. We examine shifts in country, sector and factor allocation strategies that have offered relative downside protection in prior volatile markets.
There was nowhere to hide for multi-asset investors following the announcement of U.S. tariffs on April 2, with nearly all liquid assets and markets suffering sharp drawdowns. Year-to-date, as of April 10, the picture is somewhat different, with a few assets, such as gold, government bonds and high-grade credit, offering safe harbor amid the storm.
In this blog post, we review performance across asset classes, employ scenario analysis to assess the outlook for MAC portfolios and highlight potential opportunities, based on previous market crises.
Returns across asset classes

Data through April 10, 2025. Returns are gross total in USD. From top to bottom the indexes shown are the MSCI Gold Futures, MSCI ACWI ex US Currency, MSCI Developed Markets Government Bond, MSCI EAFE IMI, MSCI USA Government Bond, MSCI USD Emerging Markets Sov Bond, MSCI USD IG Corporate Bond, MSCI USD HY Corporate Bond, MSCI Emerging Markets, MSCI USA ex Mega Cap Select, MSCI USA IMI, MSCI USA Mega Cap Select, MSCI USA Small Cap and MSCI Global Digital Assets Indexes.
Equities
Global equities have been severely impacted by the tariffs. Quarter to date, the MSCI USA Investable Market Index (IMI) fell by 6.3% while the MSCI EAFE IMI, reflecting international developed markets, also declined by 4.2%. China and Emerging Markets suffered falls of 10.1% and 6.4% respectively.
Performance since the beginning of the year paints a somewhat different picture. While U.S. equities plunged by 10.8%, international developed market equities rose by 2.1% and European equities increased by 4.3%. Latin America was the star performer of the year so far with the MSCI EM Latin America IMI increasing by 7.2% year-to-date.
International equities outperformed
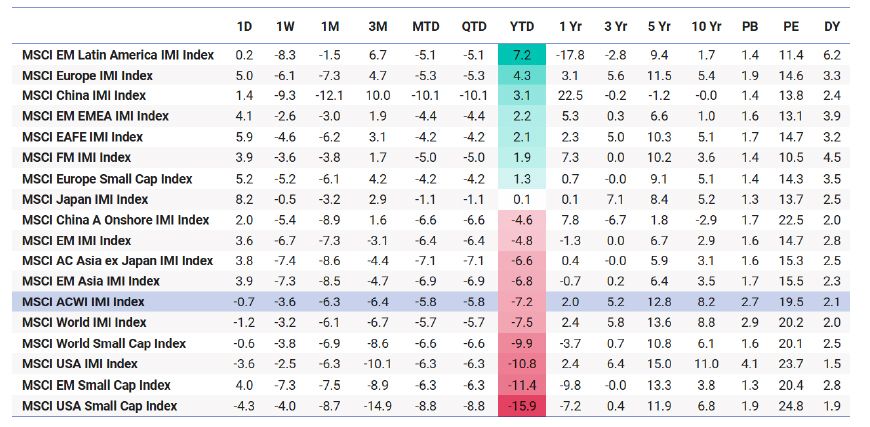
Gross returns in USD for the period ending April 10, 2025. Returns are annualized for periods longer than a year. Valuation ratios as of end of month adjusted by month to date returns.
Equity sector performance shows clear evidence of a flight to quality. Defensive sectors such as utilities and consumer staples top the table both quarter and year-to-date, while cyclicals such as discretionary and technology suffered severe drops since the start of the year.
Defensive sectors outperformed
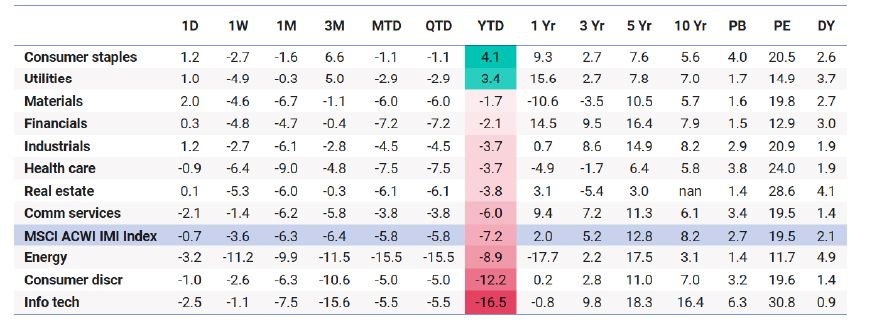
Gross returns in USD for the period ending April 10, 2025. Returns are annualized for periods longer than a year. Valuation ratios as of end of month adjusted by month-to-date returns.
Fixed income
Bond markets have also reacted to the tariffs with government bond yields initially edging lower by up to 40 basis points across major bond markets, as investors seemed to focus more on risks to growth than the inflationary impact of tariffs. U.S. corporate bond spreads widened across all credit ratings, as fears of a recession rose precipitously since the start of the second quarter.
Lower yields and wider credit spreads

10-year government bond yields, cumulative change in basis points.

10-year USD corporate bond option adjusted spreads (OAS) for different credit ratings, cumulative change in basis points.
Currencies and commodities
The USD had been declining steadily since the start of the year, dropping by up to 8% against other major currencies. The announcement on April 2 had a mixed impact. The USD dropped further against the EUR and JPY but stayed flat or recovered slightly against other major currencies, after the tariff announcement.
Commodity prices have also been affected negatively. Oil prices fell 15% following the tariff announcement, reaching their lowest level since April 2021, as the global economic outlook deteriorated sharply. Gold, which had rallied by 50% in the past three years, initially declined and then recovered, following the announcement.
The USD fell since the start of the year and following the tariff announcement


Navigating an uncertain outlook
The outlook for markets remains uncertain as investors grapple with the implications of tariffs and prepare for additional volatility. Several questions remain: Does the 90-day pause on tariffs announced on April 9 mean there is a possibility for de-escalation? Will other countries respond by raising their tariffs on imports in a tit-for-tat retaliation? Will the Fed and other central banks cut rates to help support the economy, or will they follow a cautious approach, given potential inflationary pressure? Will consumers and companies reduce spending, leading to further adverse impact on economic activity?
Most forecasters agree that tariffs will have a negative impact on growth[1], but the magnitude of the growth shock remains uncertain. There is even less consensus on the outlook for inflation. To gain insights, we assess two scenarios, a recession scenario, with U.S. GDP growth plunging to -3% and inflation falling to 2.5%, and a stagflation scenario, with growth falling to 0% and inflation spiking to 4.5%.
We use the MSCI Macro Finance Model to translate the macro scenarios into expected returns. The two scenarios have similar implications for public and private equities: U.S. equities fall by 17%, while international equities fare better in relative terms, registering declines of up to 9% and private equity drops by 13%. On the other hand, these scenarios have distinct implications for fixed income assets. In a recession, Treasury Inflation Protected Securities (TIPS), Treasurys and high-grade credit could rally by between 8% to 11%, while in stagflation, Treasurys decline by 3% and only TIPS offer a modest positive return of 2%.
Analyzing two scenarios

History informs implications for multi-asset portfolios
The charts above show that expected returns for a hypothetical multi-asset portfolio would be negative under both scenarios. In a recent blog post, we describe a process for making tactical allocation shifts to help inform investors as they seek to improve expected returns under different short-term scenarios, while staying close to the original long-horizon allocation.
Asset class performance in previous periods of market turmoil offers a map for seeking opportunities in the current mayhem.
In equities, from a country perspective, investors have found opportunities by rotating into international and emerging market equities and by seeking markets that may be relatively less affected by trade tensions. From a sector perspective, historically, defensive sectors such as utilities and consumer staples outperformed cyclical sectors, such as industrials and technology. Factor-based equity strategies have also exhibited a distinct market cycle profile with minimum volatility, in particular offering some relative protection in choppy markets.
In credit markets, a recession scenario would point to opportunities in TIPS, Treasurys and investment-grade credit. A stagflation scenario would be more difficult to navigate, as only TIPS may provide positive return — and a low return at that. Across currencies and commodities, potential opportunities may include traditional "safe" currencies and certain precious metals.
In short, volatile markets present great risk but also offer plenty of potential opportunities for tactical asset allocation shifts.
The authors thank Thomas Verbraken and Georgina Toronyi for their contributions to this blog post.


Subscribe todayto have insights delivered to your inbox.
1 Matthew Boesler, “Economists Slash US Growth, Boost Inflation Forecasts on Tariffs,” Bloomberg, April 3, 2025.
The content of this page is for informational purposes only and is intended for institutional professionals with the analytical resources and tools necessary to interpret any performance information. Nothing herein is intended to recommend any product, tool or service. For all references to laws, rules or regulations, please note that the information is provided “as is” and does not constitute legal advice or any binding interpretation. Any approach to comply with regulatory or policy initiatives should be discussed with your own legal counsel and/or the relevant competent authority, as needed.