Private Capital in Focus: 2025 Trends to Watch
Private capital — spanning debt, equity and real assets — has rapidly expanded over the past decade and enters 2025 with USD 2 trillion of dry powder.[1] These markets also go into the year faced with challenges, unknowns, as well as some grounds for optimism.
The focus for many investors in private markets is the broader economic environment, as they deal with the ongoing impact of the spike in central-bank rates that began in early 2022 and tackle issues such as trade tariffs.
The high-rate regime has provided private-credit investors with favorable returns, but at the same time, there's a pressing need to address the heightened risks of default in a prolonged period of elevated rates. Tighter monetary policy has also introduced an additional layer of complexity in the exit market, as the rising cost of capital has placed downward pressure on multiples. Following periods of slow exit activities in 2023 and 2024, the new year raises more questions about not only distribution rates, which are at historically low levels, but bigger questions about asset allocations that are impacted by private funds' extended holding periods.
In the realm of trade and tariffs, electric-vehicle (EV) manufacturing is at the center of a rapidly shifting trade environment that could reshape supply chains and private-capital flows. For investors in energy transition, identifying financial opportunities in 2025 will require further transparency into supply chains across regions.
In this blog post, we detail four key trends to help investors in private markets tackle the opportunities and risks in the year ahead.
1/ Distributions stuck in a holding pattern
After a period of exuberance in 2021, distributions from private-capital funds have slowed significantly across most asset classes. With the possible exception of private credit, we have not seen holding-level distribution rates as low as current rates since the global financial crisis (GFC). In addition to the broad slowdown, we find significant variation in the degree of slowing by deal vintage (or equivalently, deal age) using MSCI's deal-level private-capital data.
While cash flows for most historical vintages follow a remarkably similar path, more recent vintages are clearly drifting away from the pack — their distributions have stalled and early exits have evaporated. This is most noticeable for venture capital and perhaps least marked for private credit, where such a slowdown would be entirely unexpected.[2]
Recent distribution rates have fallen far below historical averages across some key asset classes. For buyout, mature holdings have seen their distribution rates roughly halve. For younger holdings, however, distribution rates have fallen even further relative to recent norms. For venture capital, the effect persists even out to five-year-old holdings before reverting to about half of what is historically typical.
In 2025, private-capital investors will continue watching — and waiting — for distributions. There may be both cyclical and structural headwinds at play as exit opportunities remain limited and the private-capital landscape continues to evolve. Are long holding periods reflective of a new normal?
Recent distributions have been low, especially for young holdings
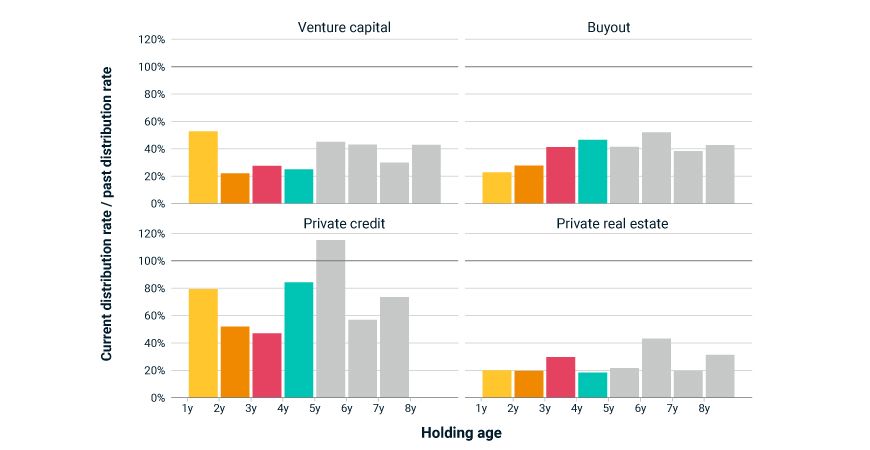
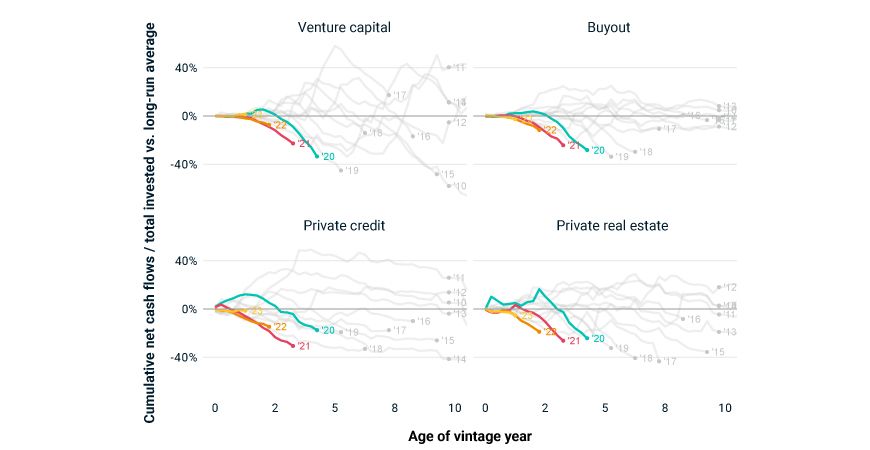
The first chart shows current distribution rates (quarterly distributions over starting valuation) in the last year as a fraction of distribution rates in the previous decade, by holding age. The second chart shows pooled net cash flows calculated as cumulative distributions less cumulative contributions as a fraction of the cumulative contributions of each holding vintage year minus the same net cash flow number averaged over all vintages. Data for both charts as of Q2 2024 from the MSCI Private Capital Manager Universe; all figures are calculated in USD.
2/ Shrinking gap in valuation multiples may offer encouragement on buyout exits
Driven by the rapid increase in interest rates, investors have been forced to reassess asset valuations, and thus allocation strategies due to the denominator effect. Although listed markets quickly reflected these adjustments, private markets are still repricing their assets.
In buyouts, over the long term, general partners will typically value their investments conservatively, resulting in higher valuations for exited investments, but when the market swings rapidly this relationship can reverse. For the third year in a row, exits have occurred at lower valuation multiples (total enterprise value/EBITDA) compared to those still held by funds, a gap not seen in buyout investments since 2009 and the GFC.
The pricing gap has narrowed to a mere 0.3x in 2024 through the third quarter, however. Such a shrinking could offer some support to optimism that the pace of exits will increase in 2025 from the low level of the past couple of years.
Mind the gap: exit multiples have been lower than those of active investments
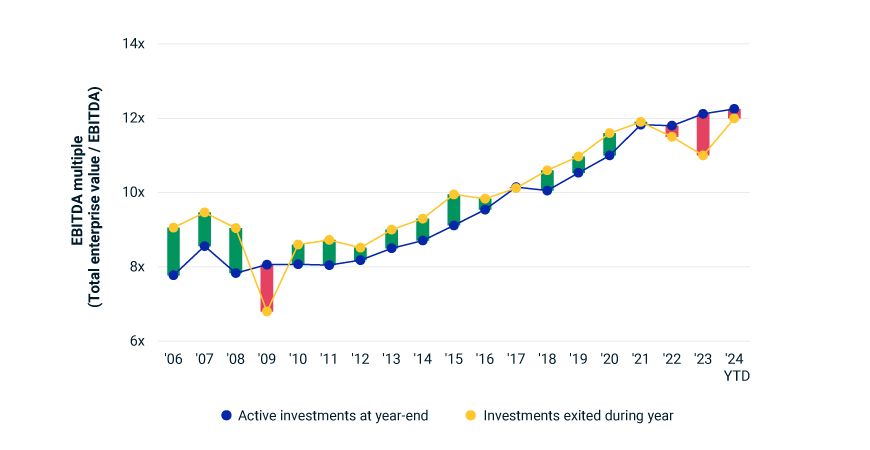
Data as of Q3 2024 from the MSCI Private Capital Manager Universe.
3/ Private credit tests uncharted waters
Private-credit funds posted strong returns in 2024 as the strategy experienced its first real interest-rate cycle, but the winds may be shifting heading into 2025. Index rates (like the secured overnight financing rate) are still up 450 basis points since the start of 2022, creating crosscurrents for private credit. Higher interest rates continue to buoy returns from performing floating-rate loans, but some borrowers have begun to founder under now-burdensome debt-service costs.[3] How general partners (GPs) navigate this new interest-rate environment will be a key consideration for private-credit investors looking to the year ahead.
GPs have already begun to change tack when it comes to subordinated lending — spreads on mezzanine corporate loans have been drifting downward over the past two years and are now almost indistinguishable from senior loans. This suggests that mezzanine lenders are tightening underwriting to avoid a wave of defaults down the line. Loan valuations indicate that mezzanine lenders may have righted the ship, positioning themselves for a period of prolonged elevated interest rates. Rates of distress in mezzanine loans have retreated since 2023 and are (broadly) converging on distress rates seen in senior loans, which have themselves spent several quarters in choppy waters.
With an eye on 2025, private-credit investors find themselves in uncharted territory. Much will depend on the future path of interest rates. A series of rate cuts could bail out senior lenders, who may have taken on more risk than their investors realized. Alternatively, if interest rates persist around 5%, loan values could sink further. Asset owners concerned about their private-credit portfolios would be well served to begin monitoring loans sooner rather than later.
Private-credit distress rates remained elevated
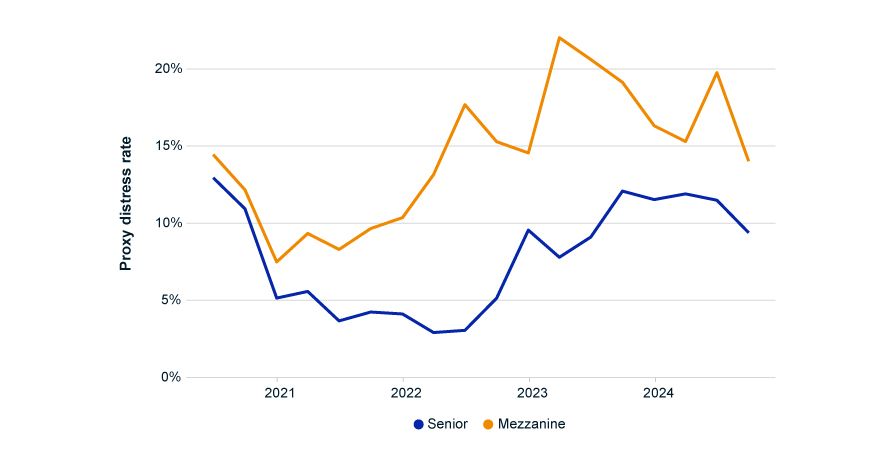
Proxy distress rates by calendar quarter. Loans with market value reported at below 80% of cost basis are treated as nonperforming. MSCI Private Capital Transparency Data; Q3 2024 data is preliminary.
4/ Private investments in green mobility: Eyes on a charged-up trade environment
Private-capital funds are increasingly allocating capital to energy-transition opportunities and driving superior returns compared to public-market counterparts, as of Q2 2024.[4] Within energy transition, low-carbon automobiles and their components have emerged as a critical area of focus, providing technological innovation, environmental impact and financial returns. Focusing on the returns side, we identified a sample of portfolio companies in the Global Industry Classification Standard (GICS®) automobiles and components industry group that touch aspects of green-mobility activities, such as manufacturing EVs and their components.[5] We will refer to this subset as "green mobility."
As our final exhibit shows, since Q3 2019, private investments in green mobility have delivered a five-year cumulative return (gross of fees) of 290%, compared to 164% and 149% for venture capital and buyout overall, respectively, as of Q3 2024. Green mobility, however, has encountered pronounced challenges since peaking in Q4 2021. Between Q4 2021 and Q3 2024, the cumulative return was -50%, compared to the -12% return in venture capital and the 24% gain in buyouts.
Venture-capital funds were the most active asset class within the green-mobility space, accounting for 40% of the roughly USD 5.8 billion net asset value (NAV), while buyout funds represented 28%. Regionally, investment holdings in portfolio companies in Asia accounted for about 59% of the green-mobility NAV, considerably surpassing those in North America (28%) and Europe (12%) and underscoring Asia's influence in this space.
In 2024, the U.S., Canada and the European Union ramped up tariffs on Chinese EV imports, raising questions about the future distribution of global EV manufacturing and investment flows.[6] While these questions are still outstanding, private-capital investors may need to carefully review how their portfolio companies are navigating the shifting trade environments and how they may capitalize on the potential manufacturing opportunities across various regions.
Green-mobility returns still riding high while Asia fuels the EV race
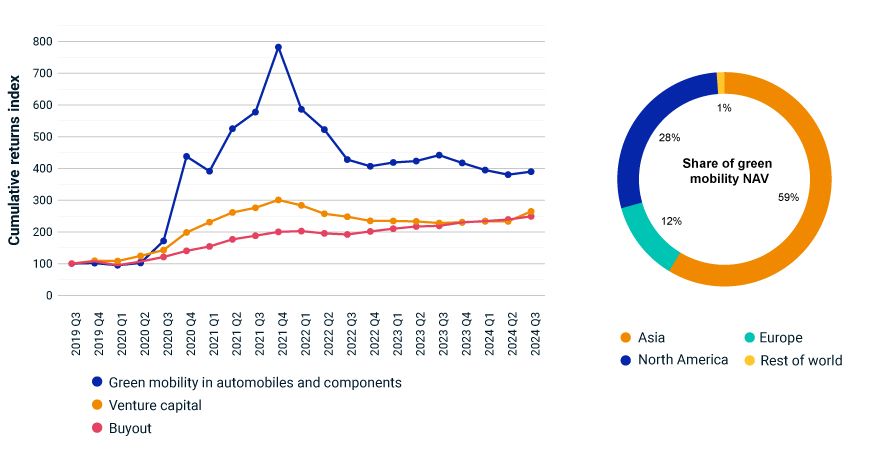
Left-side chart shows cumulative quarterly returns since Q3 2019. All returns calculated in USD, gross of fees. Right-side chart: total underlying NAV is about USD 5.8 billion. Data for both charts as of Q3 2024 from the MSCI Private Capital Manager Universe.


Subscribe todayto have insights delivered to your inbox.
1 Dry powder as of Sept. 30, 2024. From vintages 2004-2013 to 2014-2023, fund counts have increased by 102%, while capitalization has increased by 149%. The cumulative capitalization of funds is more than USD 11 trillion. Data as of the Q3 2024 update of the MSCI Private Capital Manager Universe; capitalizations exclude funds of funds.2 Private credit benefits from holding predominantly floating-rate loans, and the nature of the investment means assets self-liquidate.3 Eric Platt and Brooke Masters, “BlackRock private equity fund takes more than $600mn hit on investment,” Financial Times, Jan. 8, 2025.4 The returns in the private markets were based on exited and active investment holdings, making them subject to factors such as lack of liquidity, irregular cash flows, subjective valuations and smoothing. In private active investment holdings, valuation smoothing may understate volatility, especially for shorter time horizons, while public-equity valuations are not subject to smoothing.5 GICS is the global industry classification standard jointly developed by MSCI and S&P Global Market Intelligence. We screened company descriptions against a set of keywords and phrases that may suggest some connection with green mobility. Examples of the keywords and phrases include EVs, low-carbon automobile and hybrid vehicles. We limited the screening to portfolio companies in the automobiles and components industry group. While this may not encompass all companies in green mobility, the objective is to assess the returns of these investments. Data as of Q3 2024 from the MSCI Private Capital Manager Universe.6 Brendan Murray, “Canada Joins Nations Using Tariffs to Combat Chinese EV Imports,” Bloomberg, Aug. 27, 2024.
The content of this page is for informational purposes only and is intended for institutional professionals with the analytical resources and tools necessary to interpret any performance information. Nothing herein is intended to recommend any product, tool or service. For all references to laws, rules or regulations, please note that the information is provided “as is” and does not constitute legal advice or any binding interpretation. Any approach to comply with regulatory or policy initiatives should be discussed with your own legal counsel and/or the relevant competent authority, as needed.